Construct a less-than-cumulative frequency distribution

Assignment Help Advanced Statistics
Reference no: EM13500397

QUESTION 1

The following graph, drawn to scale, represents the grouped frequency distribution of the time spent on the Internet by a randomly-selected sample of Internet subscribers during their most recent session.
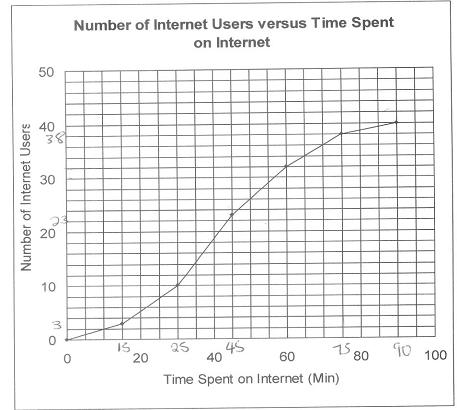
2246_Construct cumulative frequency distribution.png

1.1 Construct a less-than-cumulative frequency distribution of the data represented by the graph.
1.2 Use the information obtained in 1.1 above to calculate each of the following quantities.

1.2.1 mode
1.2.2 mid 65% range
1.2.3 standard deviation

QUESTION 2

The probability that a call-centre consultant receives 3 calls during any given hour is 0.1404 and the probability that the consultant receives 5 calls during any given hour is 0.1755. Assuming that the calls are Poisson-distributed, calculate the probability that the consultant receives at least 2 calls during any 30 minute period.

QUESTION 3

A bank with a branch located in the commercial district of a city has developed an improved process for serving customers during the 12:00 to 13:00 peak lunch period. The waiting times, during this period, of all customers was recorded over a period of one week. The waiting times (in min) of 15 randomly-selected customers is given below.

4.21

5.55

3.02

5.13

4.77

2.34

3.54

3.20

4.50

6.10

0.38

5.12

6.46

6.19

3.79

Suppose that another bank located in a residential area is most concerned with the Friday evening hours from 5 to 7. A sample of the waiting times of 15 randomly-selected customers is given in the table below.

9.66

5.90

8.02

5.79

3.82

8.01

8.35

10.49

6.68

5.64

4.08

6.17

9.91

5.47

8.73

Conduct a full test, at the 5% level of significance, to establish whether there is a statistically significant difference between the population mean times in the two banks. (Assume that the samples are drawn from populations that are approximately normally distributed and that their variances are equal.)

QUESTION 4

The managers of a retail giant are preparing revenue plans for the period from October 2013 to March 2014. The data given below represents the amounts (in $m) of one of their main products.


Apr-Jun

Jul-Sep

Oct-Dec

Jan-Mar

2009/10

49

37

58

67

2010/11

50

38

59

68

2011/12

51

40

60

70

2012/13

50

42

-

-

Use the moving-average method to make seasonally-adjusted trend estimates for the third and fourth quarters of 2013 and the first two quarters of 2014. Assume that the cyclical and irregular forces have minimal influence on the time series. (Show details of all your calculations.)

QUESTION 5

A company with an ageing product range is investigating the launch of a new range. Its business analysts have mapped out the following scenarios.

Scenario 1

Continue with the old range with profits declining at 10% per annum on a compounding basis. Profits from this range for the previous year totaled $60000.

Scenario 2

Introduce a new range without any prior market research. If sales are high, annual profit is put at $90000 with a probability of 0.7. If sales are low, annual profit is put at $30000, with a probability of 0.3.

Scenario 3

Introduce a new range with prior market research costing $30000. The market research will indicate whether future sales are likely to be "good" or "bad". If the research indicates "good", then the management will spend $35000 more on capital equipment and this will increase the annual profit to $1000000, provided sales are actually high. However, if sales are actually low, the annual profit will drop to $25000. Should management decide not to spend more on promotion (given a good research report), then profit levels will be as for scenario 2. If the research indicates "bad", then management will scale down their expectations for an annual profit of $70000.

Probability calculations reveal the following information.

The probability of a favourable research report = 0.59.

The probability of high sales given a favourable research report = 0.95.

The probability of high sales given an unfavourable research report = 0.34.

With the aid of a decision tree prepare a quantitative report advising the company on the optimal course of action.

(Use a time horizon of 6 years and ignore the time value of money.)

Reference no: EM13500397

Questions Cloud

Find the speed of the cannonball just before it hits ground : A 2.5kg cannonball is fired from the top of a cliff. The cannonball leaves the cannon at a height of h=75 m above the ground below. what is the speed of the cannonball just before it hits the ground
Fast food places are to blame for people being obese : A couple years ago I heard of people suing fast food places for them being fat,
Explain the lead iodide dissolves according to the reaction : Assume that a student places 1.0 mol of solid PbI2 in 1.0 L of water. Part of the lead iodide dissolves according to the following reaction PbI2(s) Pb2+ (aq) + 2I-(aq) After allowing the solution to sit for 30 minutes the student determines that th..
Compute all ratios from the module : Prepare a schedule reflecting a ratio analysis of each company. Compute all ratios from the module for which you have enough data.
Construct a less-than-cumulative frequency distribution : Conduct a full test, at the 5% level of significance, to establish whether there is a statistically significant difference between the population mean times in the two banks.
What is the speed of the sound in the liquid : An ultrasound unit sends a 2.4 MHz sound wave into a 35cm long tube filled with an unkown liquid. What is the speed of the sound in the liquid
Project for human resources management : Project for Human Resources Management
Evaluate the value of the equilibrium constant : After equilibrium was reached, it was found that 1.30 mol gaseous nitrogen monoxide (nitric oxide)was present. The other product formed in the reaction is sulfur trioxide. Calculate the value of the equilibrium constant , Kc, for this reaction.
Which company would you select : You have the opportunity to invest $10,000 in one of two companies that are part of the same industry.

Reviews

Write a Review

Advanced Statistics Questions & Answers

  Build up a two-way anova analysis

Formula for sample size n with given margin of error m and con dence level C for population proportion and please simplify the model by dropping the insigni cant terms

  Question about negative numbers

Do children have an understanding of negative numbers? If so, what is their understanding? If not, how might you help them develop an understanding of negative numbers?

  Range and mean not good predictor of variability

Four sets are listed in the table below. Each set represents a sample. Find the range, mean, and standard deviation for each set. Use your results to fill in the table.

  Forecast errors for sophisticated models

All forecasts contain some error whether the model is simple or sophisticated, because forecasts are predictions of the future based on past data. Forecast errors can be caused by changes in conditions that generated the past data

  Credit default swap-unconditional default probability

Calculate a simple one-year credit default swap spread using a recovery rate of 30% and an unconditional default probability of 4%. Assume that there are no accruals, payments are made annually and ignore discounting any cash flows.

  Break-even point and equilibrium point

A company, sells and repairs old bicycles and parts for replacement. Sell reconstructed pictures at a unit price of $ 50. The fixed cost of equipment for re construction of the tables is $ 500.

  Protocolfield trial intervention study i want to write a

i want to write a typical protocol about the topic that we presented about but i want to write to them in detail

  What are the labor hours productivity

What is the average number of customers waiting in line to purchase a ticket and what is the probability that there are at least two others waiting in line to buy a ticket?

  Determine necessary control limits - quality and performance

Design the appropriate control chart - based on your chart and the data from the last 3 weeks, what can you conclude about the absenteeism of nurses' aides

  Suppose that it people use m3 to commute to london by car

suppose that it people use m3 to commute to london by car. each drivers chooses how many times to travel a year s. the

  Determining probability of correctly answering

Find the probability of correctly answering the first 2 questions on a multiple choice test if random guesses are made and each question has 5 possible answers.

  Calculate the correlation matrix for all variables

Enter the following data into SPSS and calculate the correlation matrix for all four variables. Identify which correlations are significant and state and interpret your findings. Report significant correlation coefficients and p values.

Free Assignment Quote

Assured A++ Grade

Get guaranteed satisfaction & time on delivery in every assignment order you paid with us! We ensure premium quality solution document along with free turntin report!

All rights reserved! Copyrights ©2019-2020 ExpertsMind IT Educational Pvt Ltd