Construct a less-than-cumulative frequency distribution

Assignment Help Basic Statistics
Reference no: EM13254351

QUESTION 1

The following graph, drawn to scale, represents the grouped frequency distribution of the time spent on the Internet by a randomly-selected sample of Internet subscribers during their most recent session

663_Cumulative frequency distribution.png

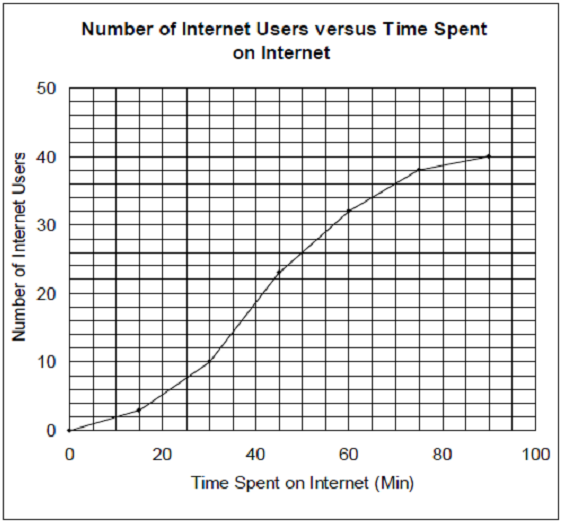
1.1 Construct a less-than-cumulative frequency distribution of the data represented by the graph.
1.2 Use the information obtained in 1.1 above to calculate each of the following quantities.
     1.2.1 mode
     1.2.2 mid 65% range
     1.2.3 standard deviation

QUESTION 2

The probability that a call-centre consultant receives 3 calls during any given hour is 0.1404 and the probability that the consultant receives 5 calls during any given hour is 0.1755. Assuming that the calls are Poisson - distributed, calculate the probability that the consultant receives at least 2 calls during any 30 minute period.

QUESTION 3

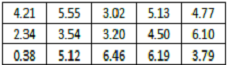
A bank with a branch located in the commercial district of a city has developed an improved process for serving customers during the 12:00 to 1300 peak lunch period. The waiting times, during this period, of all customers was recorded over a period of one week. The waiting times (in min) of 15 randomly-selected customers is given below.

1153_Cumulative frequency distribution1.png

Suppose that another bank located in a residential area is most concerned with the Friday evening hours from 5 to 7. A sample of the waiting times of 15 randomly-selected customers is given in the table below.

1261_Cumulative frequency distribution2.png

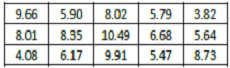
Conduct a full test, at the 5% level of significance, to establish whether there is a statistically significant difference between the population mean times in the two banks. (Assume that the samples are drawn from populations that are approximately normally distributed and that their variances are equal.)

QUESTION 4

The managers of a retail giant are preparing revenue plans for the period from October 2013 to March 2014. The data given below represents the amounts (in $m) of one of their main products.

1119_Cumulative frequency distribution3.png

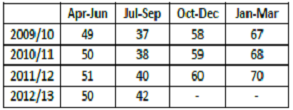
Use the moving-average method to make seasonally-adjusted trend estimates for the third and fourth quarters of 2013 and the first two quarters of 2014. Assume that the cyclical and irregular forces have minimal influence on the time series.

QUESTION 5

A company with an ageing product range is investigating the launch of a new range. Its business analysts have mapped out the following scenarios.

Scenario 1

Continue with the old range with profits declining at 10% per annum on a compounding basis. Profits from this range for the previous year totaled 560000.

Scenario 2

Introduce a new range without any prior market research. If sales are high, annual profit is put at 590000 with a probability of 0.7. If sales are low, annual profit is put at 530000, with a probability of 0.3.

Scenario 3

Introduce a new range with prior market research costing 530000. The market research will indicate whether future sales are likely to be "good" or "bad". If the research indicates "good", then the management will spend 535000 more on capital equipment and this will increase the annual profit to SLOCOXO, provided sales are actually high. However, if sales are actually low, the annual profit will drop to 525000. Should management decide not to spend more on promotion (given a good research report), then profit levels will be as for scenario 2. If the research indicates "bad', then management will scale down their expectations for an annual profit of 570000.

Probability calculations reveal the following information.

The probability of a favourable research report = 0.59.

The probability of high sales given a favourable research report = 0 95

The probability of high sales given an unfavourable research report = 034

With the aid of a decision tree prepare a quantitative report advising the company on the optimal course of action. Use a time horizon of 6 years and ignore the time value of money.)

Reference no: EM13254351

Questions Cloud

Find the electric force between the nucleus and electrons : A typical helium nucleus consists of two protons and two neutrons. What is the electric force between the nucleus and one of the electrons orbiting the nucleus
Define what is the solvent and the solute : Name a few solutions you come in contact with every day. What substances make up these solutions. What is the solvent and the solute
Compute the amount of n2 gas released : Calculate the amount of N2 gas released (in liters) when the diver returns to the surface of the water where the partial pressure of N2 is 0.80 atm.
Describe are h1 and h2 independent events : You have two biased coins. Coin A comes up heads with probability 1/4. Coin B comes up heads with probability 3/4. However, you are not sure which is which so you flip each coin once where the first coin you flip is chosen randomly.
Construct a less-than-cumulative frequency distribution : Construct a less-than-cumulative frequency distribution of the data represented by the graph and calculate the probability that the consultant receives at least 2 calls during any 30 minute period.
Under what circumstances does requesting cost : Under what circumstances does requesting cost or pricing data help the government or work against the government? How so?
Explain the engine coolant is pure ethylene glycol : Make the following assumptions in your calculation; at normal filling conditions, the densities of engine coolant and water are 1.11 g/mL and 0.998 g/mL respectively. Assume that the engine coolant is pure ethylene glycol (HOCH2CH2OH), which is no..
How much work is done by the gas during this expansion : Suppose 145 moles of a monatomic ideal gas undergo an isothermal expansion from 1.00m^3 to 4,00 m^3, How much work is done by the gas during this expansion
Find the new maximum power the machine can supply : A 3 phase, 208V, 4 pole, 60Hz, Y connected synchronous generator has a synchronous reactance of 8 ohm. Assume the resistance of this generator is negligible. The machine terminal voltage is maintained constant at 208V (line to line).

Reviews

Write a Review

Basic Statistics Questions & Answers

  Conditional values and probabilities

Construct a decision table for this problem. Include all conditional values and probabilities in the table.

  Estimate the average score at age thirty five

Estimate the average score at age 35 for all the individuals who scored 115 at age 18. Predict the score at age 35 for an individual who scored 115 at age 18.

  Width and height of rectangle

The width of a rectangular gate is 2 meters (m) larger than its height. The diagonal brace measures sqrt 6 m. Find the width and height.

  Calculate the interest charged by each card

Based on this information, calculate the interest charged by each card for this purchase and which card is the better deal and by how much

  Measures of dispersion or variation in a dataset

What are the 3 measures of dispersion/variation in a dataset? How do you calculate each of these 3 measures?

  Probability that driver to use seat belt just on trip

Why might driver be tempted not to use seat belt "just on this trip"?

  Computing critical values by null and alternative hypotheses

By constructing null and alternative hypotheses, computing critical values, and comparing test statistic to critical value.

  Find the predicted handspan for someone five feet tall

It was found that the correlation is about .80 and the regression equation is handspan = 3 + 0.35 height What is the predicted handspan for someone 5 feet tall?

  Phone bill and normal distribution with a mean

The amount of Jen's monthly phone bill is normally distributed with a mean of $50 and a standard deviation of $10. Find the 25th percentile.

  Compute confidence interval of the true mean

With a sample standard deviation of 200 pounds. We know the sample is from a normal distribution. The 95% confidence interval of the true mean is?

  Normal distribution of diameters of grapefruits

The diameters of grapefruits in certain orchard are normally distributed with mean of 6.95 inches and a standard deviation of 0.75 inches. Show all work.

  Does data support the researchers relevant hypothesis

Does this data support the researchers' hypothesis? Test the relevant hypotheses using α = .10 by first calculating a P-value.

Free Assignment Quote

Assured A++ Grade

Get guaranteed satisfaction & time on delivery in every assignment order you paid with us! We ensure premium quality solution document along with free turntin report!

All rights reserved! Copyrights ©2019-2020 ExpertsMind IT Educational Pvt Ltd