Reference no: EM131216922
Q1. State the complement of each of the following sets:
(a) Engineers with less than 36 months of full-time employment.
(b) Samples of cement blocks with compressive strength less than 6000 kilograms per square centimeter.
(c) Measurements of the diameter of forged pistons that do not conform to engineering specifications.
(d) Cholesterol levels that measure greater than 180 and less than 220.
Q2. Suppose that an ink cartridge is classified as being overfilled, medium filled, or underfilled with a probability of 0.40, 0.45, and 0.15, respectively.
(a) What is the probability that a cartridge is classified as not underfilled?
(b) What is the probability that a cartridge is either overfilled or underfilled?
Q3. Let X denotes the number of patients who suffer an infection within a floor of a hospital per month with the following probabilities:
|
x
|
0
|
1
|
2
|
3
|
|
P(X = x)
|
0.7
|
0.15
|
0.1
|
0.05
|
Determine the following probabilities:
(a) Less than one infection
(b) More than three infections
(c) At least one infection
(d) No infections
Q4. Suppose that f(x) = 1.5x2 for -1 < x < 1 and f(x) = 0 otherwise. Determine the following probabilities.
(a) P(0 < X)
(b) P(0.5 < X)
(C) P(.-0.5 ≤ X ≤ 0.5)
(d) P(X < -2)
(e) PAX < 0 or X > -0.5)
(f) Determine x such that P(x < X) = 0.05.
Q5. The thickness measurement of a wall of plastic tubing, in millimeters, varies according to a cumulative distribution function
Determine the following.
(a) P(X ≤ 2.0080)
(b) P(X > 2.0055)
(c) If the specification for the tubing requires that the thickness measurement be between 2.0090 and 2.0100 millimeters, what is the probability that a single measurement will indicate conformance to the specification?
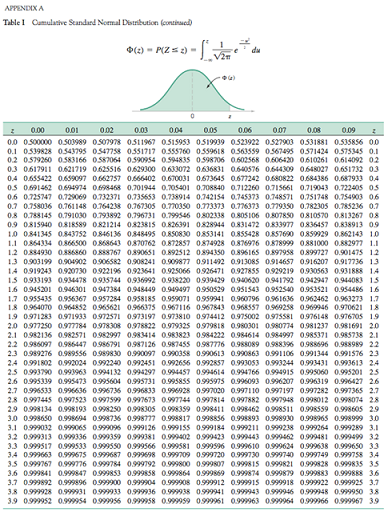
Q6. Use Appendix A Table I to determine the following probabilities for the standard normal random variable Z.
(a) P(- 1 < Z < 1)
(b) P(-2 < Z < 2)
(c) P(-3 < Z < 3)
(d) P(Z < -3)
(c) P(0 < Z ≤ 3)
Q7. The reaction time of a driver to visual stimulus is normally distributed with a mean of 0.4 second and a standard deviation of 0.03 second.
(a) What is the probability that a reaction requires more than 0.5 second?
(b) What is the probability that a reaction requires between 0.4 and 0.5 second?
(c) What is the reaction time that is exceeded 90 of the time?
Q8. The life of a semiconductor laser at a constant power is normally distributed with a mean of 7000 hours arid a standard deviation of 600 hours.
(a) What is the probability that a laser fails before 50150 hours?
(b) What is the life in hours that 95% of the lasers exceed?
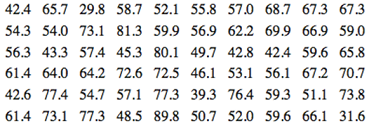
Q9. An important quality characteristic of water is the concentration of suspended solid material. Following are 60 measurements on suspended solids from a certain lake. Construct a stein-and-leaf diagram for these data and comment on any important features that you notice.
Q10. Construct a cumulative frequency plot and histogram for the weld strength data from Question 11.
(a) Use 8 bins.
(b) Use 16 bins and compare with part (a).
Q11. The shear strengths of 100 spot welds in a union alloy follow. Construct a stern-and-leaf diagram for the weld strength data and comment on any important features that you notice.
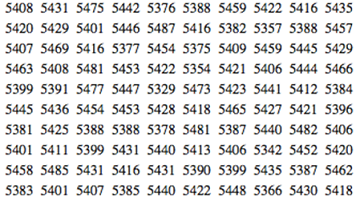
Construct a stem-and-leaf display for these data.
Q12. The following information on structural defects in automobile doors is obtained: dents, 4 pits, 4; parts assembled out of sequence, 6; parts undertrimmed, 21; missing holes/slots, 8; parts not lubricated, 5; parts out of contour, 30; and parts not debarred, 3. Construct and interpret a Pareto chart.
Q13. Eighteen measurements of the disbursement rate (in cm3/sec) of a chemical disbursement system are recorded and sorted:
6.50 6.77 6.91 7.38 7.64 7.74 7.90 7.91 8.21
8.26 8.30 8.31 8.42 8.53 8.55 9.04 9.33 9.36
(a) Compute the sample mean and sample variance.
(b) Find the sample upper and lower quartiles.
(c) Find the sample median.
(d) Construct a box plot of the data.
(e) Find the 5th and 95th percentiles of the inside diameter.
Q14. The following table shows U.S. petroleum imports, imports as a percentage of total, and Persian Gulf imports as a percentage of all imports by year since 1973 (source: U.S. Department of Energy Web site https://www.eia.doe.gov/). Construct and interpret either a digidot plot or a marginal plot) or a separate stem-and-leaf and time series plot for each column of data.
|
Year
|
Petroleum Imports (thousand barrels per day)
|
Total Petroleum Imports as Percent of Petroleum Products Supplied (percent)
|
Petroleum Imports from Persian Gulf as Percent of Total Petroleum Imports (percent)
|
|
1973
|
6256
|
36.1
|
13.5
|
|
1974
|
6112
|
36.7
|
17.0
|
|
1975
|
6055
|
37.1
|
19.2
|
|
1976
|
7313
|
41.8
|
25.1
|
|
1977
|
8807
|
47.7
|
27.8
|
|
1978
|
8363
|
44.3
|
26.5
|
|
1979
|
8456
|
45.6
|
24.4
|
|
1980
|
6909
|
40.5
|
21.9
|
|
1981
|
5996
|
37.3
|
20.3
|
|
1982
|
5113
|
33.4
|
13.6
|
|
1983
|
5051
|
33.1
|
8.7
|
Q15. To investigate fuel efficiency, the following data were collected.
|
MPG,
y
|
Weight,
x1
|
Horsepower,
x2
|
MPG,
y
|
Weight,
x1
|
Horsepower,
x2
|
|
29.25
|
2464
|
130
|
17.00
|
4024
|
394
|
|
21.00
|
3942
|
235
|
17.00
|
3495
|
294
|
|
32.00
|
2604
|
110
|
18.50
|
4300
|
362
|
|
21.25
|
3241
|
260
|
16.00
|
4455
|
389
|
|
26.50
|
3283
|
200
|
10.50
|
3726
|
485
|
|
23.00
|
2809
|
240
|
12.50
|
3522
|
550
|
(a) Create two scatter diagrams of the data. What do you anticipate will be the sign of each sample correlation coefficient?
(b) Compute and interpret the two sample correlation coefficients.