Reference no: EM131438594
Part A -
Q1. This problem uses data about variability in basketball scores.
The following tables show how many points were scored by the home team and away team for a sample of games during the 2014-2015 season. The scores from away teams are sorted from lowest to highest), but the scores from home teams are not sorted.
|
Sample of Scores from Away Teams
|
|
Sample of Scores from Home Teams
|
|
68
|
76
|
77
|
80
|
80
|
|
95
|
97
|
74
|
100
|
99
|
|
81
|
82
|
84
|
85
|
87
|
|
102
|
78
|
89
|
87
|
79
|
|
89
|
89
|
91
|
92
|
92
|
|
86
|
88
|
91
|
105
|
105
|
|
96
|
97
|
98
|
99
|
100
|
|
74
|
123
|
96
|
91
|
93
|
|
101
|
103
|
111
|
112
|
114
|
|
80
|
97
|
104
|
92
|
111
|
A. Calculate the values for the minimum, maximum, and range for the data values from away teams.
B. Calculate the values for the minimum, maximum, and range for the scores from home teams. It may be helpful to sort the scores first.
C. Report the values of the first and third quartiles for the scores from away teams. Report the IQR for the scores from away teams.
D. Report the values of the first and third quartiles for the scores from home teams. Report the IQR for the scores from home teams.
E. Calculate the fences for outliers for the scores from away teams. Identify any outliers.
F. Calculate the fences for outliers for the scores from home teams. Identify any outliers.
G. Draw stacked boxplots for the scores from away teams and home teams. Remember to plot any outliers using separate points. Compare the scores based on the graphs. Do the graphs indicate that playing at home can lead to higher scores? Make sure to talk about both center and variability. Refer to the specific graphs to support your conclusion.
Q2. Imagine that an error was made when the data values for typical monthly temperatures in St. Louis were recorded in the table below. The first two digits for the July temperature were reversed. It was supposed to be 79.8 but was written as 97.8.
|
|
Jan
|
Feb
|
Mar
|
Apr
|
May
|
Jun
|
Jul
|
Aug
|
Sep
|
Oct
|
Nov
|
Dec
|
|
St. Louis
|
29.9
|
33.9
|
45.1
|
56.7
|
66.1
|
75.4
|
97.8
|
77.6
|
70.2
|
58.4
|
46.2
|
33.9
|
A. Calculate the range with this new incorrect value and compare it with the original range you calculated in class. How does this error affect the range? Does it increase the range, decrease the range, or leave it unchanged?
B. How does this error affect the IQR? Does it increase the IQR, decrease the IQR, or leave it unchanged? (Note: The IQR is not affected much by outliers and skewing. The range is greatly affected by outliers and skewing.)
C. How does the change affect the box-plot for the data? Explain by sketching the box-plot for the data with the mistake and comparing it to the box-plot for the correct data set that you created in class.
Q3. The following table contains the ages of the 30 women who appeared on the television show The Bachelor in Season 15.
|
Bachelorette
|
Age
|
|
Bachelorette
|
Age
|
|
Alli
|
34
|
|
Lindsay
|
25
|
|
Ashley H
|
26
|
|
Lisa M
|
24
|
|
Ashley S
|
26
|
|
Lisa P
|
27
|
|
Britnee
|
25
|
|
Madison
|
25
|
|
Britt
|
25
|
|
Marissa
|
26
|
|
Chantal
|
28
|
|
Meghan
|
30
|
|
Cristy
|
30
|
|
Melissa
|
32
|
|
Emily
|
24
|
|
Michelle
|
30
|
|
J
|
26
|
|
Raichel
|
29
|
|
Jackie
|
27
|
|
Rebecca
|
30
|
|
Jill
|
28
|
|
Renee
|
28
|
|
Keltie
|
28
|
|
Sarah L
|
25
|
|
Kimberly
|
27
|
|
Sarah P
|
27
|
|
Lacey
|
27
|
|
Shawntel
|
25
|
|
Lauren
|
26
|
|
Stacey
|
26
|
A. Construct a dotplot or histogram for the ages of the bachelorettes. Describe important features of the graph.
B. Report the values in the five-number summary for the ages of the bachelorettes.
C. Construct a box-plot for the ages of the bachelorettes. Compare the box-plot you constructed in this question to the graph you constructed in Question 3A. Which do you think better represents the distribution of the ages of the bachelorettes? Explain your reasoning.
D. Think about what "quartiles" means. The quartiles divide the data set into four equal parts. What proportion of the bachelorettes were older than 26.5?
E. Looking at the box-plot, can you tell if the distribution of ages is skewed? If it is skewed, is it skewed left or right?
F. Based on what you see in the box-plot of bachelorette ages, do you think the mean or median age is likely to be larger? Give a reason for your answer.
G. Calculate the mean age for the bachelorettes. Compare it to the median. Was your answer to Question F correct?
H. What range of values represents the middle 50% of the values?
Part B -
1. Here are the names and ages of the 30 women who appeared on the television show. The Bachelor in Season 15.
|
Bachelorette
|
Age
|
|
Bachelorette
|
Age
|
|
Alli
|
34
|
|
Lindsay
|
25
|
|
Ashley H
|
26
|
|
Lisa M
|
24
|
|
Ashley S
|
26
|
|
Lisa P
|
27
|
|
Britnee
|
25
|
|
Madison
|
25
|
|
Britt
|
25
|
|
Marissa
|
26
|
|
Chantal
|
28
|
|
Meghan
|
30
|
|
Cristy
|
30
|
|
Melissa
|
32
|
|
Emily
|
24
|
|
Michelle
|
30
|
|
J
|
26
|
|
Raichel
|
29
|
|
Jackie
|
27
|
|
Rebecca
|
30
|
|
Jill
|
28
|
|
Renee
|
28
|
|
Keltie
|
28
|
|
Sarah L
|
25
|
|
Kimberly
|
27
|
|
Sarah P
|
27
|
|
Lacey
|
27
|
|
Shawntel
|
25
|
|
Lauren
|
26
|
|
Stacey
|
26
|
The ages are summarized in the dot-plot below.
The mean of these ages is 26.9 years. Compute the standard deviation for the ages of the women on the show. Include units with your answer. Explain what the standard deviation means in the context of their ages.
Q2. We examined the weight gains (in grams) over a one-month period for two samples of laboratory rats. One sample contained six adolescent rats that were given a high daily dose of a stimulant drug. This sample was called the Treatment group. The sample of six normal adolescent laboratory rats was the Control group. This group received no treatment.
Here are the weight gains for the two groups:
|
Control Group
|
169
|
154
|
179
|
202
|
197
|
175
|
|
Treatment Group
|
137
|
158
|
153
|
147
|
168
|
147
|
These values are summarized in the dot-plots below.
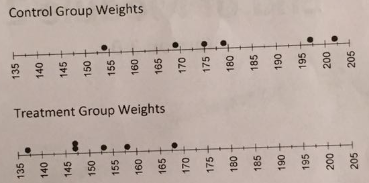
A. Use technology to compute the standard deviations for the weight gains in each group. Be sure to include the units.
B. Write a brief comparison of the standard deviations for the weight gains of the two groups. When making your comparison, think about differences, or variability, between the groups. Also think about whether the standard deviations show that the variability in the distributions is substantially different or not. Explain your reasoning.