Reference no: EM132403364
Assignment - Approximate Confidence Intervals with the Normal and t Distribution
Use R as a calculator to solve these exercises.
Part A - Confidence intervals for proportions
Do textbook exercises -
5.8 Twitter users and news, Part I. A poll conducted in 2013 found that 52% of U.S. adult Twitter users get at least some news on Twitter. The standard error for this estimate was 2.4%, and a normal distribution may be used to model the sample proportion. Construct a 99% confidence interval for the fraction of U.S. adult Twitter users who get some news on Twitter, and interpret the confidence interval in context.
5.12 Mental health. The General Social Survey asked the question: "For how many days during the past 30 days was your mental health, which includes stress, depression, and problems with emotions, not good?" Based on responses from 1,151 US residents, the survey reported a 95% confidence interval of 3.40 to 4.24 days in 2010.
(a) Interpret this interval in context of the data.
(b) What does "95% confident" mean? Explain in the context of the application.
(c) Suppose the researchers think a 99% confidence level would be more appropriate for this interval. Will this new interval be smaller or wider than the 95% confidence interval?
(d) If a new survey were to be done with 500 Americans, do you think the standard error of the estimate be larger, smaller, or about the same.
6.2 Young Americans, Part I. About 77% of young adults think they can achieve the American dream. Determine if the following statements are true or false, and explain your reasoning.
(a) The distribution of sample proportions of young Americans who think they can achieve the American dream in samples of size 20 is left skewed.
(b) The distribution of sample proportions of young Americans who think they can achieve the American dream in random samples of size 40 is approximately normal since n ≥ 30.
(c) A random sample of 60 young Americans where 85% think they can achieve the American dream would be considered unusual.
(d) A random sample of 120 young Americans where 85% think they can achieve the American dream would be considered unusual.
6.8 Life rating in Greece. Greece has faced a severe economic crisis since the end of 2009. A Gallup poll surveyed 1,000 randomly sampled Greeks in 2011 and found that 25% of them said they would rate their lives poorly enough to be considered "suffering".
(a) Describe the population parameter of interest. What is the value of the point estimate of this parameter?
(b) Check if the conditions required for constructing a confidence interval based on these data are met.
(c) Construct a 95% confidence interval for the proportion of Greeks who are "suffering".
(d) Without doing any calculations, describe what would happen to the confidence interval if we decided to use a higher confidence level.
(e) Without doing any calculations, describe what would happen to the confidence interval if we used a larger sample.
6.10 Legalization of marijuana, Part I. The General Social Survey asked 1,578 US residents: "Do you think the use of marijuana should be made legal, or not?" 61% of the respondents said it should be made legal.
(a) Is 61% a sample statistic or a population parameter? Explain.
(b) Construct a 95% confidence interval for the proportion of US residents who think marijuana should be made legal, and interpret it in the context of the data.
(c) A critic points out that this 95% confidence interval is only accurate if the statistic follows a normal distribution, or if the normal model is a good approximation. Is this true for these data? Explain.
(d) A news piece on this survey's findings states, "Majority of Americans think marijuana should be legalized." Based on your confidence interval, is this news piece's statement justified?
Part B - Confidence intervals
Do textbook exercises -
6.22 Sleep deprivation, CA vs. OR, Part I. According to a report on sleep deprivation by the Centers for Disease Control and Prevention, the proportion of California residents who reported insufficient rest or sleep during each of the preceding 30 days is 8.0%, while this proportion is 8.8% for Oregon residents. These data are based on simple random samples of 11,545 California and 4,691 Oregon residents. Calculate a 95% confidence interval for the difference between the proportions of Californians and Oregonians who are sleep deprived and interpret it in context of the data.
6.30 An apple a day keeps the doctor away. A physical education teacher at a high school wanting to increase awareness on issues of nutrition and health asked her students at the beginning of the semester whether they believed the expression "an apple a day keeps the doctor away", and 40% of the students responded yes. Throughout the semester she started each class with a brief discussion of a study highlighting positive effects of eating more fruits and vegetables. She conducted the same apple-a-day survey at the end of the semester, and this time 60% of the students responded yes. Can she used a two-proportion method from this section for this analysis? Explain your reasoning.
7.16 True / False: paired. Determine if the following statements are true or false. If false, explain.
(a) In a paired analysis we first take the difference of each pair of observations, and then we do inference on these differences.
(b) Two data sets of different sizes cannot be analyzed as paired data.
(c) Consider two sets of data that are paired with each other. Each observation in one data set has a natural correspondence with exactly one observation from the other data set.
(d) Consider two sets of data that are paired with each other. Each observation in one data set is subtracted from the average of the other data set's observations.
7.18 Paired or not? Part II. In each of the following scenarios, determine if the data are paired.
(a) We would like to know if Intel's stock and Southwest Airlines' stock have similar rates of return. To find out, we take a random sample of 50 days, and record Intel's and Southwest's stock on those same days.
(b) We randomly sample 50 items from Target stores and note the price for each. Then we visit Walmart and collect the price for each of those same 50 items.
(c) A school board would like to determine whether there is a difference in average SAT scores for students at one high school versus another high school in the district. To check, they take a simple random sample of 100 students from each high school.
7.26 Diamonds, Part II. In Exercise 7.24, we discussed diamond prices (standardized by weight) for diamonds with weights 0. 99 carats and 1 carat. See the table for summary statistics, and then construct a 95% confidence interval for the average difference between the standardized prices of 0.99 and 1 carat diamonds. You may assume the conditions for inference are met.
|
|
0.99 carats
|
1 carat
|
|
Mean
|
$44.51
|
$56.81
|
|
SD
|
$13.32
|
$16.13
|
|
n
|
23
|
23
|
Part C - Various other problems
Do textbook exercises -
7.6 Working backwards, Part II. A 90% confidence interval for a population mean is (65, 77). The population distribution is approximately normal and the population standard deviation is unknown. This confidence interval is based on a simple random sample of 25 observations. Calculate the sample mean, the margin of error, and the sample standard deviation.
7.14 SAT scores. The standard deviation of SAT scores for students at a particular Ivy League college is 250 points. Two statistics students, Raina and Luke, want to estimate the average SAT score of students at this college as part of a class project. They want their margin of error to be no more than 25 points.
(a) Raina wants to use a 90% confidence interval. How large a sample should she collect?
(b) Luke wants to use a 99% confidence interval. Without calculating the actual sample size, determine whether his sample should be larger or smaller than Raina's, and explain your reasoning.
(c) Calculate the minimum required sample size for Luke.
7.22 High school and beyond, Part II. We considered the differences between the reading and writing scores of a random sample of 200 students who took the High School and Beyond Survey in Exercise 7.20. The mean and standard deviation of the differences are x-read-write = 0.545 and 8.887 points.
(a) Calculate a 95% confidence interval for the average difference between the reading and writing scores of all students.
(b) Interpret this interval in context.
(c) Does the confidence interval provide convincing evidence that there is a real difference in the average scores? Explain.
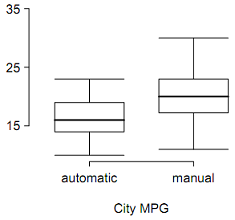
7.28 Fuel efficiency of manual and automatic cars, Part I. Each year the US Environmental Protection Agency (EPA) releases fuel economy data on cars manufactured in that year. Below are summary statistics on fuel efficiency (in miles/gallon) from random samples of cars with manual and automatic transmissions. Do these data provide strong evidence of a difference between the average fuel efficiency of cars with manual and automatic transmissions in terms of their average city mileage? Assume that conditions for inference are satisfied.
|
|
City MPG
|
|
|
Automatic
|
Manual
|
|
Mean
|
16.12
|
19.85
|
|
SD
|
3.58
|
4.51
|
|
n
|
26
|
26
|
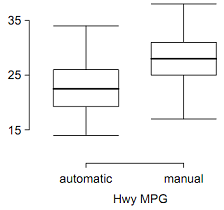
7.30 Fuel efficiency of manual and automatic cars, Part II. The table provides summary statistics on highway fuel economy of the same 52 cars from Exercise 7.28. Use these statistics to calculate a 98% confidence interval for the difference between average highway mileage of manual and automatic cars, and interpret this interval in the context of the data.
|
|
Hwy MPG
|
|
|
Automatic
|
Manual
|
|
Mean
|
22.92
|
27.88
|
|
SD
|
5.29
|
5.01
|
|
n
|
26
|
26
|
Textbook - OpenIntro Statistics, Fourth Edition by David Diez, Mine Cetinkaya-Rundel and Christopher D Barr.
Attachment:- Assignment Files.rar