Reference no: EM132248589
Assignment - Development of a Portfolio of Loans
The Seashore Bank derives much of its income from its portfolio of loans - principally to private clients. All the loans, which have been issued by Seashore Bank can be classified into four risk-based categories:
1. Good Loans: These are the loans which are still in progress which have been given to low-risk customers. It is expected that nearly all of these loans will be paid up in full with time.
2. Risky loans: These are the loans which are still in progress, but which have been given to medium- or high-risk customers. It is expected that a number of these customers will default on repayment of their loans.
3. Bad loans: The customers to whom these loans were given have already defaulted - there is little chance that the loan will subsequently be repaid.
4. Paid up loans: These loans have already been paid in full.
Based on historical data it is possible to draw up a model which allocates current loans to a category based on the risk of default and which anticipates how the loans evolve from year to year (i.e. what happens to all the good loans in a given year etc.). The evolution may be represented using a transition matrix.
The percentage (by value) estimates for the loan categories (for loans initiated in 2016) in 2018 are:
|
Good Loans
|
56%
|
|
Risky Loans
|
14.4%
|
|
Bad Loans
|
3.2%
|
|
Paid-Up Loans
|
26.4%
|
Table 1. Estimated loans distribution in 2018.
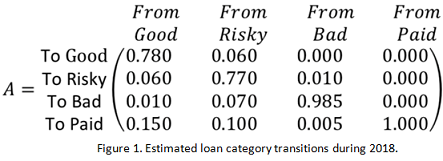
The transition matrix A below shows the evolution of each category of loan. Thus, typically in a given year 78% of loans classified as 'Good' remain good and collect interest, while 6% of these loans are re- classified as Risky (owing to changes in the circumstances of the borrower) but are still ongoing, 1% are defaulted on and 15% are fully paid up. Similar changes may be identified for the other categories as illustrated
Part (A): (Matrix computations and Gaussian Elimination. All steps MUST be clearly shown in your solutions, and work to 5 decimal places accuracy throughout.)
(i) Set up the 2018 loan distribution (shown in Table 1) as a column vector. Then use matrix multiplication with the loan transition matrix A (as shown in Figure 1) to compute the percentage of the current loans in each of the four categories in 2019.
(ii) Use Gaussian (Gauss-Jordan) elimination (without pivoting) to compute the inverse of A.
(iii) Assume that the percentages given in A also describe the loan category evolutions during 2017, show how matrix inversion and multiplication allow you to compute the distribution of loans across the four categories in 2017 (you can see where the current loans came from). Hence compute the loan distributions in 2017.
Part (B): (Matrix Operations in Microsoft's Excel (You MUST use Excel to complete this part.)
Unknown to many users, Excel can do a lot of matrix operations very efficiently, either directly or through the use of built-in matrix functions. Some of the commonly used are the functions MMULT, TRANSPOSE and MINVERSE. (You may need to investigate how these functions work in Excel. Use the Excel's online Help facility to find out more.)
Your task in Part (B) is to use an Excel spreadsheet to compute the estimated distribution of loans across the categories in the years 2016, 2017, 2019 and 2020. Your final spreadsheet may look like the one shown in Figure 2 (in attached file).
Suggestions and notes:
(i) You may assume that the category movement percentages given in A also describe the changes to loan categories during 2016 (the year that the loans were initiated), 2017, 2019, 2020 and 2021.
(ii) Start with a blank Excel spreadsheet and in a block of cells, say B4:B7, enter the loan figures for the four categories. Then enter the transition matrix A in H4:K7, and so on.
(iii) You MUST demonstrate that your spreadsheet is constructed using appropriate Excel functions and formulas. NO credits will be given for manually entering numbers.
(iv) You should use the results from your spreadsheet to check your own calculations in Part (A).
Attachment:- Assignment File.rar