Compute the mean and standard deviation

Assignment Help Simulation in MATLAB
Reference no: EM131456354

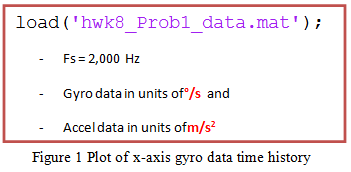
Q1. Using the provided quiescent gyro data file (hwk8_Prob1_data.mat), plot the x-axis data in deg/s vs time in Figure 1 (be sure to add a title, axis labels, and units)

977_Figure.png

a. Compute the mean and standard deviation.

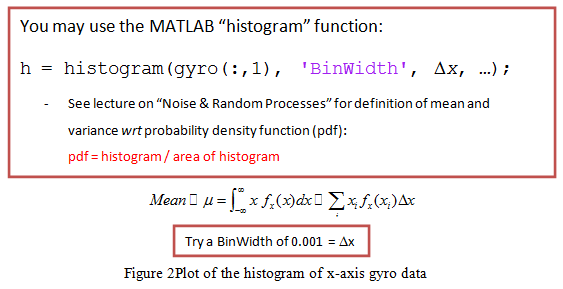
b. Plot the histogram (in Figure 2) of this data and using ONLY the histogram data again compute the mean and standard deviation.

1953_Figure1.png

c. Plot the autocorrelation function of the x-gyro signal in Figure 3 for τ = 0 to 1sec

420_Figure2.png

d. Compute the standard deviation using only the computed autocorrelation fn.

e. Compute the average power in the signal.

f. Plot the one sided power spectral density of the signal.

Q2. Self-alignment: Given the accel data (in m/s2) and gyro data (in rad/s) of an IMU at rest (load file "hwk8_Prob2_data.mat") on earth's surface at a latitude of Lt = 34.6155794o, longitude of λt = -112.4504o, and height of ht = 1578 m determine the orientation of the body wrt the n-frame.  Assume that the IMU is perfectly aligned with the b-frame and local gravity is g = 9.79213m/s2.

a. Use the scalar method: Develop a MATLAB fn [roll, pitch, yaw, C_n__b] = coarse_alignment_scalar(gyro, accel)

which accepts the means of the (assumed stationary) gyro and accel data and determines angles (in rad) and C_n__b. Compute the following:

i. Roll =

ii. Pitch =

iii. Yaw =

iv.  Cbn

b. Use the vector method: Develop a MATLAB fn [C_n__b] = coarse_alignment_vector(gyro, accel, Lb, g)

which accepts the means of the (assumed stationary) gyro and accel data, Latitude (in rad), and local g (in m/s2)to determine C_n__b.  Compute the following: Cbn.

Attachment:- Assignment Files.rar

Reference no: EM131456354

Questions Cloud

How do those details reflect their social-cultural context : Choose at least three details from each of these. How do those details reflect their social and cultural context?
Write about cyber security in maritime transportation system : Write a paper about Cyber security in the Maritime Transportation System. Your research paper should be 10-12 pages of content excluding your title page.
Review a job description through a job website : Demonstrate with at least two examples how your newly acquired knowledge and skills have shaped both your personal and professional development.
Show the sampling distribution of mean amount of medicare : Americans have become increasingly concerned about the rising cost of Medicare. In 1990, the average annual Medicare spending per enrollee was 53267.
Compute the mean and standard deviation : EE 440 Assignment. Compute the mean and standard deviation. Plot the autocorrelation function of the x-gyro signal in Figure 3 for t = 0 to 1sec
Generate a new set of random numbers : Bob Miller, a food critic, wants to prepare an article on the quality of food at locally owned restaurants in Myrtle Beach.
Explain the nature of the threat and the specific challenges : Regarding the strategic challenge you have selected, explain the nature of the threat and the specific challenges it poses to the nation.
What rate of return do you expect to earn on your investment : The YTM on a bond is the interest rate you earn on your investment if interest rates don’t change. What rate of return do you expect to earn on your investment?
What are the main issues in the below case study : 1. What are the main issues in the below case study? 2. What are the Project Risks? 3. How these risks can be mitigated?

Reviews

len1456354

4/10/2017 1:00:16 AM

Topic: Navigation System (Electrical Engineering). Detailed Question: I have this homework in navigation system. I attached the Word file for the homework. I already did some question and I need you to do the rest. Also you will find MATLAB codes in the attached zip file. These codes provided by the teacher to use in this homework. I will also attach an empty word file to see how it was before I did some plots. Please check it carefully because many said they can do it but then after time gone the reply sorry we cannot.

Write a Review

Simulation in MATLAB Questions & Answers

  Calculate the stress intensity factor

Use the three-parameter zone finite element method or the boundary collocation method to calculate the stress intensity factor K, at the crack tip for the plate

  Build a simulation using newtons laws of motion

Build a new and different simulation of your own using Newtons laws of motion and Show the code and describe how it works

  Write the specification of load mover

Write the specification of LOAD MOVER detailed of the whole design and precise for automatic control section and divide the design into various modules and Is the kernel required if yes which one?

  Design the automatic control section using statecharts

Aim of this project is to design an embedded system which can move loads from one place to another. The system can be operated manually, automatically and wirelessly.

  Need an expert who can model a drill in simulink

Need an expert who can model a drill in Simulink. Working model of a drill needing for an improvment to behave more realistically as a drill to drill through plastic block.

  Project is on load frequency control using fpid

Project is on load frequency control using FPID tuned using GA and PSO algorithm and the system is a two area system.

  Number of packets received with time

Let x be the number of packets received with time -

  Build a matlab based graphical user interface

Build a Matlab based graphical user interface (GUI) that operates in conjunction with a base Matlab/ Simulink simulation program. Any base simulation is considered acceptable.

  Build a matlab based graphical user interface

Build a Matlab based graphical user interface (GUI) that operates in conjunction with a base Matlab/ Simulink simulation program. Any base simulation is considered acceptable.

  Simulate the standardised sum of independent

Simulate the standardised sum of independent and identically distributed variates - Fit a linear regression model as in Q5, and plot your estimates for β0 and β1 as N increases, together with a line indicating their true values. Supply your code.

  Plot the original periodic square wave

Plot the original periodic square wave on the same graph. Comment on the difference between the original periodic square wave and its truncated Fourier series presentation.

  Use matlab to plot the function

Plot the original periodic square wave on the same graph. Comment on the difference between the original periodic square wave and its truncated Fourier series presentation.

Free Assignment Quote

Assured A++ Grade

Get guaranteed satisfaction & time on delivery in every assignment order you paid with us! We ensure premium quality solution document along with free turntin report!

All rights reserved! Copyrights ©2019-2020 ExpertsMind IT Educational Pvt Ltd