Reference no: EM132852264
Expected materials to be submitted by the candidate.
1 Jupyter notebook with clear notes within the code detailing all the important steps. We recommend use of Anaconda (Python 3.7 version).
2 The candidate will be expected to do a 15min presentation on the submitted code.
Question 1
The Weather Station Efficiency 2020 file is an excel workbook with 12 sheets (from Jan 2020 - Dec 2020). Each sheet has got monthlydata onEfficiency of the weather station. Every day,Meteorologists record the efficiency of the Weather stations and send this data to the Analyst. The Analyst is expected to analyse the dataand to draw some insights on the total running time, reliability and the Mean Time between Failures (MTBF) of the weather stations.
1a. Your task as the analyst is write a code usingJupyter Notebook that reads the Weather Stations Efficiency 2020 file and compile the annual data into one sheet. Refer to example as shown in Figure 1 below.
(NB:The number of Weather Stations per month is not fixed, new weather stations can be deployed and some existing stations can be decommissioned.)
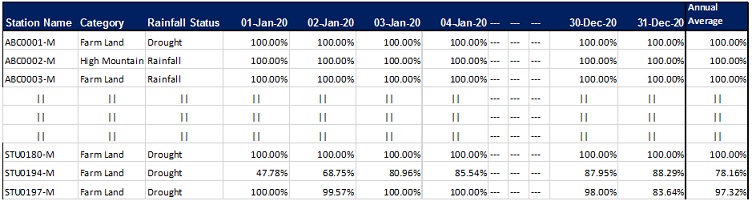
Figure 1 - Example of daily Weather station efficiencies in one sheet.
1b. Compute the average daily and annual efficiencies for all Weather Stations for Drought and Rainfall status. Plot the daily and Annual Efficiencies on a graph or graphs of your choice to bring out important insights.
Attachment:- Analyst Practical Questions.rar