Reference no: EM131399511
In an experiment conducted by one of this book's authors, 19 students were asked to estimate (in millions) the population of Canada, which was about 30 million at that time. Before they made their estimates, ten of the students (Group 1) were told that the population of the United States was about 290 million at that time. Nine of the students (Group 2) were told that the population of Australia was roughly 20 million at that time. The estimates for the population of Canada given by the students in each group were:
Group 1: 2, 30, 35, 70, 100, 120, 135, 150, 190, 200
Group 2: 8, 12, 16, 29, 35, 40, 45, 46, 95
a. Find the five-number summary for Group 1.
b. Find the five-number summary for Group 2.
c. Compare the values of the range for the two groups.
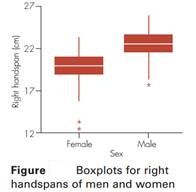
d. Draw a boxplot that compares the two groups. Refer to Figure 2.14 (p. 34) for guidance.
|
How did he become chinas most influential teacher
: What was Confucius life like how did he become China's most influential teacher?
|
|
Find the kth smallest value in a collection of n values
: Using the class of minheaps defined in Project 1, implement your algorithm as a method at the client level.
|
|
Determining the behavioral design pattern
: Select and submit a Behavioral Design Pattern; explain why you selected that particular pattern.
|
|
Insert a print screen of the display settings
: How do you show hidden files, folders, and drives in Windows 7? Explain how an insert a print screen image of the Folder Options dialog box in Windows 7.
|
|
Compare the values of the range for the two groups
: Find the five-number summary for Group 1.- Find the five-number summary for Group 2.- Compare the values of the range for the two groups.
|
|
Administrators to change the id assigned
: The DoGood Donor application contains a page that allows administrators to change the ID assigned to a donor in the DD_DONOR table. Create a PL/SQL block to handle this task.
|
|
Write a program that will iterate 1000 times
: In the previous step, let n = 10, 20, 30, 40, 50, 60, 70, 80, 90, 100, 200, 400, and 800. For each n, see whether the average number of calls to compareTo is greater than or equal to the lower bound n - 1 (see Exercise 7) and less than or equal to..
|
|
Describe the shape of given dataset
: Create a dotplot for these ages.- Describe the shape of this dataset.- Are there any outliers in this dataset?- Create a stem-and-leaf plot for these ages.
|
|
Write an efficient algorithm for combining two heaps
: Write an efficient algorithm for combining two heaps, one with size n and the other with size 1. What is the Big Oh performance of your algorithm?
|