Reference no: EM131680022
Major Assignment
*All group members are to exert an equal amount of effort on all questions of the assignment. Students should not divide sections. If a student has contributed to only some sections, the contribution of the student should be equal to the marks it carries. A student with less than 100% contribution will receive marks proportional to their contribution.
An insight into student demand for smartphones at La Trobe University.
Executive Summary
I. Introduction:
Provide an introduction to what this assignment is about, the techniques of analysis, and how your sample was selected.
II. Data Analysis:
This section must answer the following specific questions.
Section A: Basic Analysis
1. Gender Proportion:
A. What proportion of the students in your sample are male and what proportion are female? Report your results in the following table.
|
Gender
|
Sample proportion
|
|
Female
|
81
|
|
Male
|
69
|
B. Use an appropriate chart to graphically display information in the table above.

C. Explanation.
In this question, to show the gender proportion we have used pie charts. Whereas it is the suitable graph to clearly show how many females and males have participated in this survey which was conducted to calculate how many people uses smart phones.
2. Average Monthly Bill:
A. What is the average monthly bill of students by gender in your sample? Report your results in the following table.
|
|
Female
|
Male
|
|
Average Monthly Bill ($)
|
62.34
|
67.74
|
B. Use an appropriate chart to graphically display information in the table above.
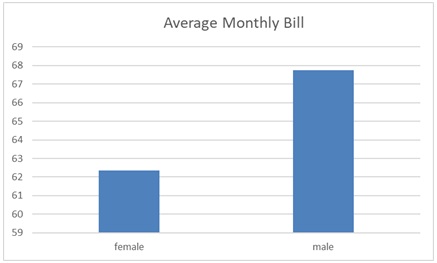
C. Compare the average monthly bill of females and males.
According to the above graph it clearly shows that males have a highest average monthly bill comparatively to the females. whereas the difference between males and females are 5.4. Therefore, we can say that the males spend more than females to pay for the monthly mobile bill.
3. Earnings and money spent on mobile phone:
A. What is the average monthly earning of students by gender in your sample? Report your results in the following table. (1 mark)
|
|
Female
|
Male
|
|
Average Monthly Earnings ($)
|
1416.600732
|
1120.897143
|
B. Is there any relationship between earning and money spent on mobile usage? Use an appropriate chart to illustrate your answer.
C. Provide the following statistical measures to test the relationship between earning and money spent on mobile usage.
|
|
Female
|
Male
|
|
Covariance
|
|
|
|
Coefficient of Correlation
|
|
|
|
Coefficient of Determination
|
|
|
|
Y-intercept
|
|
|
|
Slope
|
|
|
|
Least Squares Line
|
|
|
What do the statistics in part [C] tell you about the relationship between earning and money spent on mobile usage for males and females? Explain your results.
4. Market share of mobile phone brand:
A. Complete the following cross classification tables
Cross classification table by frequency
|
|
|
Brand
|
Total
|
|
|
|
Apple
|
Samsung
|
LG
|
Do not use mobile
phone
|
Other smart phone
|
Basic mobile phone
|
|
Gender
|
Male
|
|
|
|
|
|
|
|
|
Female
|
|
|
|
|
|
|
|
|
Total
|
|
|
|
|
|
|
|
Cross classification table by total relative frequency
|
|
|
Brand
|
Total
|
|
|
|
Apple
|
Samsung
|
LG
|
Do not use mobile
phone
|
Other smart phone
|
Basic mobile phone
|
|
Gender
|
Male
|
|
|
|
|
|
|
|
|
Female
|
|
|
|
|
|
|
|
|
Total
|
|
|
|
|
|
|
|
B. Use an appropriate chart to graphically display the information above.
C. Is there any difference in the market share of each mobile phone brand by gender?
Section B: Intermediate Market Analysis
5. Relationship between the earning of students and choice of mobile phone:
A. Calculate the average income of students by brand. Report your results in the following tables.
Frequency
|
|
Brand
|
Total
|
|
|
Apple
|
Samsung
|
LG
|
Do not use mobile
phone
|
Other smart phone
|
Basic mobile phone
|
|
Average
income ($)
|
|
|
|
|
|
|
|
B. Use an appropriate chart to graphically display the information above and summarise the results.
C. Divide income into three categories at your discretion (low, middle and high) and complete the following tables.
Cross classification table by frequency
|
|
|
Brand
|
Total
|
|
|
|
Apple
|
Samsung
|
LG
|
Do not use mobile
phone
|
Other smart phone
|
Basic mobile phone
|
|
Income Level ($)
|
High
|
|
|
|
|
|
|
|
|
Medium
|
|
|
|
|
|
|
|
|
Low
|
|
|
|
|
|
|
|
|
Total
|
|
|
|
|
|
|
|
Cross classification table by total relative frequency
|
|
|
Brand
|
Total
|
|
|
|
Apple
|
Samsung
|
LG
|
Do not use mobile
phone
|
Other smart phone
|
Basic mobile phone
|
|
Income Level ($)
|
High
|
|
|
|
|
|
|
|
|
Medium
|
|
|
|
|
|
|
|
|
Low
|
|
|
|
|
|
|
|
|
Total
|
|
|
|
|
|
|
|
D. Employ an appropriate graph to compare the distribution of brand selection across the income groups.
E. Provide an explanation on relationship between income and the choice of mobile phone. Is there a relationship?
6. The effect of price on preference [Samsung versus Apple]:
A. iPhone and Samsung are two important players in the smartphone market who compete against each other. Samsung's phones are generally sold cheaper than Apple's smartphones. Complete the following table using the survey data responses
|
Discount offered on Samsung Galaxy
|
Proportion of customers who said they will buy the latest Samsung Galaxy instead of the latest iPhone if the Galaxy was discounted.
|
|
x
|
y
|
|
0%
|
|
|
5%
|
|
|
10%
|
|
|
15%
|
|
|
20%
|
|
|
25%
|
|
|
30%
|
|
|
35%
|
|
|
40%
|
|
|
45%
|
|
|
50%
|
|
B. Using Excel, produce a scatter plot to summarize the relationship between potential market share and proposed discount offered by Samsung on its latest Galaxy vis-à-vis the latest iPhone.
C. Complete the following table then interpret the statistics.
|
|
Statistic
|
|
Covariance
|
|
|
Coefficient of Correlation
|
|
|
Coefficient of Determination
|
|
|
Y-intercept
|
|
|
Slope
|
|
|
Least Squares Line
|
|
D. Using your answer to [A], [B] and [C], does Samsung's market share, relative to Apple, increase or decrease with the discount offered by Samsung? Which customers are more loyal to their brand?
7. The effect of price on preference & gender[Samsung versus Apple]:
Compare the discount and market-share relationship in question 6 across gender.
A. Complete the following table using the survey data responses
|
Discount offered on Samsung Galaxy
|
Proportion of customers who said they will buy the latest Samsung Galaxy instead of the latest iPhone if the Galaxy was discounted
|
|
|
Females
|
Males
|
|
x
|
yF
|
yM
|
|
0%
|
|
|
|
5%
|
|
|
|
10%
|
|
|
|
15%
|
|
|
|
20%
|
|
|
|
25%
|
|
|
|
30%
|
|
|
|
35%
|
|
|
|
40%
|
|
|
|
45%
|
|
|
|
50%
|
|
|
B. Using Excel, produce a scatter plot to summarize the relationship between potential market share of males and females, and proposed discount offered by Samsung on its latest Galaxy vis-à-vis the latest iPhone. (1 mark)
C. Complete the following table and note any differences between the statistics for females and males.
|
|
Statistic
|
|
|
Females
|
Males
|
|
Covariance
|
|
|
|
Coefficient of Correlation
|
|
|
|
Coefficient of Determination
|
|
|
|
Y-intercept
|
|
|
|
Slope
|
|
|
|
Least Squares Line
|
|
|
D. Using your answer to [A], [B] and [C], does Samsung's market share, relative to Apple, increase or decrease across gender, with the discount offered by Samsung? Is there a difference in brand loyalty for females and males?
Section C: Advance scenarios
8. Confidence intervals:
Suppose, you randomly selected a student from the 2017 BUS1BAN class.
a. How likely is it that the student will be a female and how likely is it that the student will be a male?
Provide 95% interval estimates for each gender, show the confidence intervals graphically, and interpret your results.
i. Females
ii. Males.
b. How likely is it that the student will be using a smartphone? Provide a 99% interval estimate, show the confidence interval graphically and interpret your results.
9. Confidence intervals (part 2):
A. What is the average monthly earnings of male and female students at La Trobe?
B. Provide 95% interval estimates for each gender, show the confidence intervals graphically, and interpret your answer.
i. Females
ii. Males.
10. Hypothesis Testing:
A US market survey shows that the market share of iPhone is more than 40% of the US market. Is this true for La Trobe students as well? Use your sample data to test this claim at 1%, 5% and 10% levels of significance and interpret your answers.
Clearly label and follow the 5 steps of hypothesis testing procedure as outlined on the formula sheet.
III. Summary and discussion:
Provide an overview of this report (summarize your main results from your analysis of the data (responses to sections A, B and C)).
Critically evaluate the sampling method used in this assignment. Can the result of your sample be generalized to all La Trobe Students?
Suggest ways in which the problem(s) issues you have raised can be addressed to make the survey results representative of ALL La Trobe students.
Attachment:- Survey data.xlsx