Reference no: EM132290316
Assignment Questions -
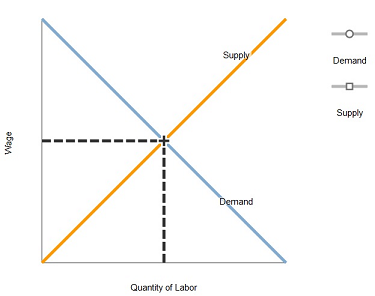
Q1. Show the effect of each of the following events on the market for labor in the architecture industry.
A slowdown in the economy reduces the demand for new buildings.

Fewer college students major in architecture.
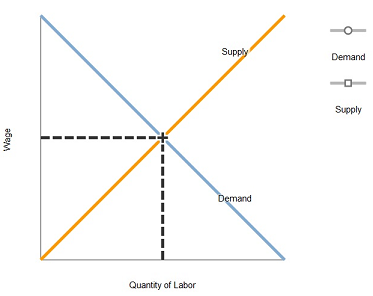
Architecture firms cut down on the purchase of computers and other equipments as budget tight
Q2. Problems and Applications
Suppose that labor is the only input used by a perfectly competitive firm. The firm's production function is as follows:
Complete the third column of the following table by calculating the marginal product for each additional worker.
|
Days of Labor
|
Units of Output
|
Marginal Product of Labor
|
Value of the Marginal Product of Labor (Dollars)
|
|
0
|
0
|
|
|
|
1
|
10
|
|
|
|
2
|
18
|
|
|
|
3
|
25
|
|
|
|
4
|
30
|
|
|
|
5
|
34
|
|
|
|
6
|
36
|
|
|
|
7
|
37
|
|
|
Each unit of output sells for $5. Complete the fourth column of the preceding table by calculating the value of the marginal product of each worker.
Complete the following demand schedule by indicating the maximum wage the firm would be willing to pay for each quantity of labor.
|
Wage (Dollars per day labor)
|
Quantity of Labor Demanded
|
|
|
7
|
|
|
6
|
|
|
5
|
|
|
4
|
|
|
3
|
|
|
2
|
|
|
1
|
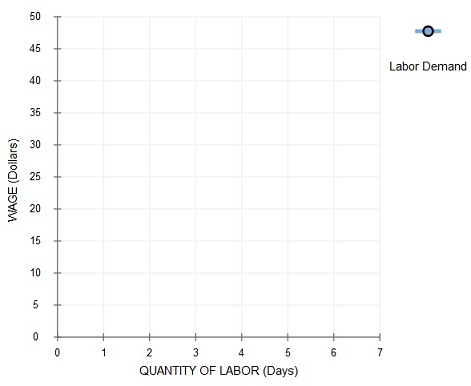
Use the blue points (circle symbol) to graph the firm's labor-demand curve, given the demand schedule you just derived.
Note: Remember to plot each point between the two integers. For example, when the number of days increases from 0 to 1, the value of the marginal product of for the first day of labor should be plotted with a horizontal coordinate of 0.5, the value halfway between 0 and 1. Line segments will automatically connect the points.
If the price of output rises from $5 to $8 per unit, the labor-demand curve _______.
Q3. Problems and Applications
Smiling Cow Dairy can sell all the milk it wants for $5 a gallon, and it can rent all the robots it wants to milk the cows at a capital rental price of $200 a day. It faces the following production schedule:
|
Number of Robots
|
Total Product (Gallons)
|
|
0
|
0
|
|
1
|
55
|
|
2
|
100
|
|
3
|
140
|
|
4
|
165
|
|
5
|
180
|
|
6
|
190
|
In what kind of market structure does the firm sell its output?
- Monopolistic
- Perfectly competitive
- Monopolistically competitive
- Oligopolistic
In what kind of market structure does the firm rent robots?
- Monopolistic
- Monopolistically competitive
- Perfectly competitive
- Oligopolistic
Complete the following table by computing the marginal product and the value of the marginal product for each additional robot.
|
Number of Robots
|
Total Product (Gallons)
|
Marginal Product (Gallons)
|
Value of the Marginal Product (Dollars)
|
|
0
|
0
|
|
|
|
1
|
55
|
|
|
|
2
|
100
|
|
|
|
3
|
140
|
|
|
|
4
|
165
|
|
|
|
5
|
180
|
|
|
|
6
|
190
|
|
|
The firm should rent ______ robots.
Q4. Problems and Applications
Your enterprising uncle opens a sandwich shop that employs 5 people. The employees are paid $20 per hour, and a sandwich sells for $5.
If your uncle is maximizing his profit, the value of the marginal product of the last worker he hired is $______, and that worker's marginal product is ______ sandwiches per hour.
Q5. Problems and Applications
Leadbelly Co. sells pencils in a perfectly competitive product market and hires workers in a perfectly competitive labor market. Assume that the market wage rate for workers is $150 per day.
Leadbelly should follow this rule to hire the profit-maximizing amount of labor: Hire workers up to the point where the ____________ is ________ $150 per day.
At the profit-maximizing level of output, the marginal product of the last worker hired is 30 boxes of pencils per day.
The price of a box of pencils is $________.
The following graphs show the labor market for pencil workers and the labor supply and demand for Leadbelly Co. Suppose some workers in the paper industry switch to jobs in the pencil industry.
Show how this change affects the pencil market by shifting the labor-demand curve, labor-supply curve, or both.
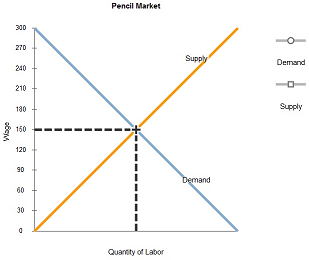
Use the green line (triangle symbol) to graph the new labor-supply curve faced by Leadbelly Co
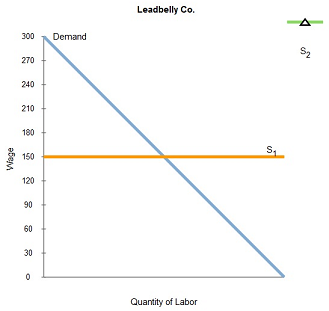
This change causes the marginal product of labor at Leadbelly to ________.
Q6. Problems and Applications
Policymakers sometimes propose laws requiring firms to give workers certain fringe benefits, such as health insurance or paid parental leave. Let's consider the effects of such a policy on the labor market.
Use the black point (plus symbol) to indicate the initial labor-market equilibrium.
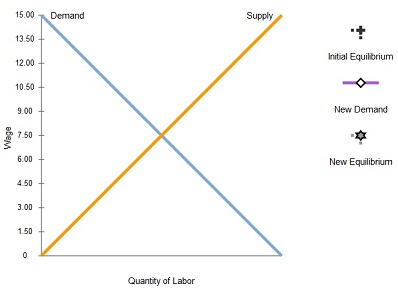
Suppose that a law required firms to give each worker $3 of fringe benefits for every hour that the worker is employed by the firm.
On the previous graph, use the purple line (diamond symbol) to graph the new labor-demand curve, assuming that the firm was not already offering fringe benefits. Then use the grey point (star symbol) to indicate the new labor-market equilibrium as a result of the required fringe benefits, assuming labor supply is unaffected by this law.
True or False: Because fringe benefits are valuable to workers, the labor-supply curve might shift in response to this law, resulting in a lower wage than if the supply curve were unchanged.
True
False
As discussed in Chapter 6, the wages of some workers, particularly the unskilled and inexperienced, are kept above the equilibrium level by minimum-wage laws.
True or False: A fringe-benefit mandate would have no effect on the employment for these workers.
True
False
Attachment:- Assignment Files.rar