Reference no: EM131167121
1. Skyscraper City has a subway system, for which a one-way fare is $1.50. There is pressure on the mayor to reduce the fare by one-third, to $1.00. The mayor is dismayed, thinking that this will mean Skyscraper City is losing one-third of its revenue from sales of subway tickets. The mayor's economic adviser reminds her that she is focusing only on the price effect and ignoring the quantity effect. Explain why the mayor's estimate of a one-third loss of revenue is likely to be an overestimate.
2. Bob, Bill, Ben, and Brad Baxter have just made a documentary movie about their basketball team. They are thinking about making the movie available for download on the Internet, and they can act as a single-price monopolist if they choose to. Each time the movie is downloaded, their Internet service provider charges them a fee of $4. The Baxter brothers are arguing about which price to charge customers per download. The accompanying table shows the demand schedule for their film.
|
Price of download
|
Quantity of downloads demanded
|
|
$10
|
0
|
|
8
|
1
|
|
6
|
3
|
|
4
|
6
|
|
2
|
10
|
|
0
|
15
|
a. Calculate the total revenue and the marginal revenue per download.
|
Price of download
|
Quantity of downloads demanded
|
Total Revenue
|
Marginal Revenue
|
|
$10
|
0
|
|
xx
|
|
8
|
1
|
|
|
|
6
|
3
|
|
|
|
4
|
6
|
|
|
|
2
|
10
|
|
|
|
0
|
15
|
|
|
b. Bob is proud of the film and wants as many people as possible to download it. Which price would he choose? How many downloads would be sold?
c. Bill wants as much total revenue as possible. Which price would he choose? How many downloads would be sold?
d. Ben wants to maximize profit. Which price would he choose? How many downloads would be sold?
e. Brad wants to charge the efficient price. Which price would he choose? How many downloads would be sold?
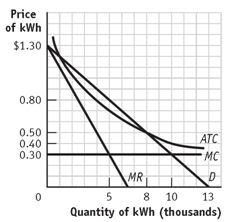
3. Diagram 1., illustrates your local electricity company's natural monopoly. The diagram shows the demand curve for kilowatt-hours (kWh) of electricity, the company's marginal revenue (MR) curve, its marginal cost (MC) curve, and its average total cost (ATC) curve. The government wants to regulate the monopolist by imposing a price ceiling.
Diagram 1
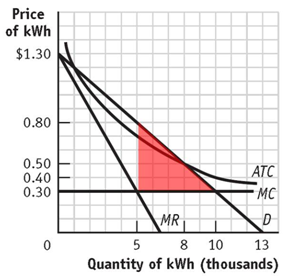
a. In diagram 2., the government does not regulate this monopolist. Which price will it charge, and how much will it produce? What does the red triangle represent? Why?
Diagram 2
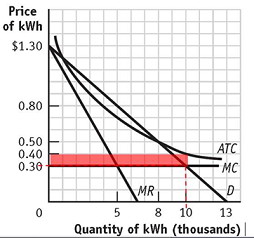
b. In diagram 3., the government imposes a price ceiling equal to the marginal cost, $0.30. Will the monopolist make profits or lose money? Explain the shaded area of the diagram and what it means for the monopolist. If the government does impose this price ceiling, do you think the firm will continue to produce in the long run?
Diagram 3
c. In diagram 4., the government imposes a price ceiling of $0.50, will the monopolist make a profit, lose money, or break even? Explain area of the diagram marked by the red dashed lines and what it means for the monopolist.
Diagram 4
|
What are the connected components of a graph
: What are the connected components of a graph?
|
|
How technology be used to overcome resistance to treatment
: Hypothesize what types of clients would be a good match for the group that you attended and/or researched. What types of clients would not be a good match? Consider age, gender, culture, race, sexuality, religion/spirituality, and the severity of ..
|
|
How an adjacency matrix can be used to represent a graph
: How can the adjacency matrix of a graph be used to determine the number of paths of length r, where r is a positive integer, between two vertices of a graph?
|
|
Define a hamilton circuit in a simple graph
: Give some properties of a simple graph that imply that it does not have a Hamilton circuit.
|
|
Calculate the total revenue and the marginal revenue
: Calculate the total revenue and the marginal revenue per download. Bob is proud of the film and wants as many people as possible to download it. Which price would he choose? How many downloads would be sold
|
|
Which would surprise you more
: Which would surprise you more:- she predicts at least 8 out of 10 correctly, or - she predicts at least 6 out of 10 correctly on each of four separate occasions?
|
|
Determine the structure-dependencies
: What tools are available to determine the structure, dependencies, and data integrity of an existing database?
|
|
Describe dijkstra''s algorithm for finding the shortest path
: Draw a weighted graph with at least 10 vertices and 20 edges. Use Dijkstra's algorithm to find the shortest path between two vertices of your choice in the graph.
|
|
Prepare the executive report based on quantitative analysis
: ACCT- Practical and written assessment - show the absolute figures from the financial statements. Also support any arguments with absolute figures from the financial statements.
|