Reference no: EM131455590
Data Analytics: Principles and Tools
Assignment
This assignment tests a variety of skills relating to
- Data Munging
- Textual Analysis
- Visualization
- Data Presentation
In this assignment, you will pre-process, analyze, and present data relating to a variety of health issues. The data set includes about 5000 entries from Twitter. You will act as a data analyst and do the following:
- Remove duplicate tweets from the dataset
- Calculate the sentiment of each tweet
- Calculate the sentiment of each group
- Visualize the hierarchical structure of the data, the rank of groups based on sentiment, and the rank of groups based on tweet volume.
- Create an infographic that summarizes your findings
1. Data Munging
- Download the tweetsSample.csv file (from OWL) that contains the tweets, and store it as an xlsm file (YourUserID_Assign3.xlsm)
If you fail to save the file as .xlsm some of your work will be lost (e.g., functions/calculations)
- Name the worksheet rawData
- First use Excel's remove duplicate feature (found in the Data toolbar) to remove the duplicate tweets based on column A (text). This should reduce the tweets from 5000 to about 3600.
- Within Excel, sort the data by column A (text)
- Create a new column titled isDup (column F)
- Create a new module and in it create a VBA function isDup that determines how similar a tweet is to another.
The function header is:
Function isDup(tweet1 As String, tweet2 As String, threshold As Double) As Boolean
- The threshold is a percentage of the number of words that they must have in common. It is based on the total number of words in the first tweet. This threshold value is fixed at 0.7 for this assignment. This means that 70% of the words must be the same. So, if the first tweet has 100 words, at least 70 of those words must be in common with the second tweet for isDup to be True. If it is less than 70 words like 56 or 34 then the tweet is not deemed a duplicate. Note: threshold is passed in as a parameter and should not be hardcoded in VBA as 0.7
- Use the isDup function (in the worksheet rawData) to determine whether a tweet is like the tweets that follows it. Check to see whether the tweet directly after it is similar. For each cell in column F (isDup), call the isDup function. (there should be about 200 - 250 TRUE values)
- Copy all the data values in the rawData into a new worksheet and name it processedData.
- Sort the isDup column and delete all the rows that have TRUE as the value.
- Delete the time and id columns
- At this point processedData should have four columns and approximately 3380 - 3400 rows.
2. Sentiment Analysis
- Copy the data in the keyword.csv file (downloaded from OWL) and add it as a new sheet, with the name keywords in your workbook.
- Next, create a VBA function that determines the sentiment of each tweet based on its contents
- The function header is:
Function sentimentCalc(tweet1 As String) As Integer
- This function should check each word in the tweet and if the word exists as one of the keywords in the positive list or negative list it should impact the overall sentiment value. The positive list and negative list words exist in the keywords sheet. Access the keywords as ranges within your VBA code. The case of the word is inconsequential. For instance, happy, HAPPY, or happy are all treated as positive words regardless of their case.
- If the word is in the positive list, it should increase the sentimentValue by 10, if it is in the negative list it should decrease it by 10
For instance, if the positive list includes "happy", "cure", "free" and the negative list includes "pain", "sick", "ill":
If the Tweet is "I am Happy that there is a cure". The sentiment value will be 10 + 10 =
20
If the Tweet is "I am happy but in pain, tired of being SICK" The sentiment value will be
10 - 10 - 10 = -10
- Use this function in your processedData worksheet to calculate the sentiment value for each tweet (store in Column E)
- Create a function with the header:
Function sentimentCategory(sentVal As Integer) As String
o if the sentiment value is greater than 0, the Sentiment Category is "Positive"
o If the sentiment value is less than 0, its category is "Negative".
o If the sentiment value is equal to 0, its category is "Neutral".
- Use the above function to determine the category for each tweet (store in Column F)
3. Descriptive Analysis
Next you will analyze the sentiment of the tweets. You will use built-in excel functions (not VBA). For most of the tasks below there are multiple ways to do it, two of which are described below.
The easiest way (but not the most effective) is to manually determine the range for each topic and use this range inside excel functions (your data must be sorted first by topic and then by group to do this). Another alternative is to use the AVERAGEIF(S)/COUNTIF(S) function and create a separate column with only one instance of each topic/group.
First create a new worksheet called analyzedData. A screen shot of what the layout of this worksheet should look like is shown below in Figure 1.
- TASK A: Calculate the overall sentiment value for each topic.
o Overall Sentiment for Topic: average of the sentiment values for the tweets within that topic (There are over 39 topics in the dataset)
- TASK B: Calculate the overall sentiment value for each group.
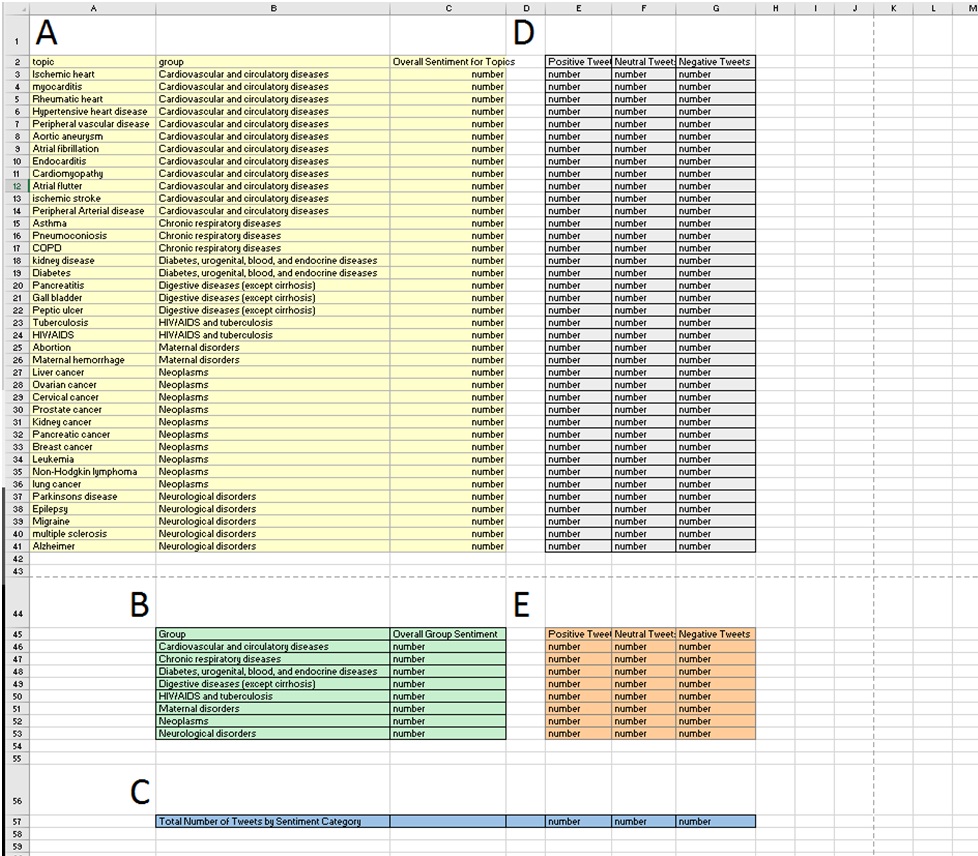
o Overall Sentiment for Group: average of the sentiment values for the tweets within each group (There are about 8 groups in the dataset)
- TASK C: Determine the total number of Positive, Negative, and Neutral Tweets in the dataset
- TASK D: Determine the number of Positive, Negative and Neutral Tweets for each group
- TASK E: Determine the number of Positive, Negative and Neutral Tweets for each topic
Figure 1: Layout of AnalyzedData worksheet
4. Visual Representations
Create visual representations using visualization software (i.e., RAW, Tableau, or Excel).
First, decide on which representation is best suitable for each task (based on the representations you have been exposed to in class, lab 8, and the ones that are available within the visualization software), then format and transform your data so it can be visualized. This task is not trivial as transforming data into a structured format is part of the representation process. When using RAW, it is important that after you determine the visual representation to be used that you use the sample data to understand the structure your data needs to be in.
You need to provide five visualizations. One visualization for each of the following tasks:
1. Show the hierarchical structure of the tweet topics and groups
2. Show the hierarchical structure and volume of tweets based on the topics and groups
3. Show the rank of groups based on the overall group sentiment value (sorted by rank)
4. Show the rank of topics based on the overall topic sentiment value (sorted by rank)
5. Show the flow of tweets (between group and topic) based on the number of positive number of tweets.
You don't need to use all the 3 visualization applications. Just determine which ones have the visualizations that are relevant to your tasks.
5. Presentation
You will not be graded on your graphic skills but on how you communicate the results.
- Using at least 3 of the visual representations you have created in Part 4, create an infographic using Microsoft Word, Paint, Adobe Photoshop, other software available to you, or one of the infographic tools below:
o Visual.ly
o Easel.ly
o Piktochart
o Venngage
- For tips on how to create infographics, start with this article 19 Warning Signs Your Infographic Stinks and search the web.
- Your infographic should:
o Explain the data set, and the images you included from part 4.
o Have at least 3 facts.
o Have a title and at least 2 sub sections.