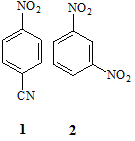
Reference no: EM13986647
Please work your reasons and calculations in an easy to understand way.
Section -A:
Answer ALL parts of this question
(A1) Assign the protons in the molecules 1 and 2 below to their appropriate 1H NMR spin systems using the simplified Pople convention.

(A2) Predict and sketch the precise appearance of the 1H NMR spectrum (assume 1st order appearance) of compound 2 in part (a) above. Your answer should include an illustrative splitting tree diagram to establish the appearance of one of the signals, as well as all anticipated chemical shifts derived from NMR parameter tables. A full answer will include a consideration of long-range splitting effects.
(B1) Assign the protons in the molecules (i) and (ii) below to their appropriate 1H NMR spin systems using the simplified Pople convention.

(B2) Predict and sketch the precise appearance of the 1H NMR spectrum of the aromatic compound (ii) in part (a) above including long-range splitting effects. Your answer should include an illustrative splitting tree diagram to establish the appearance of one of the signals, as well as anticipated chemical shifts derived from NMR parameter tables.
(C1) A sample taken from the scene of a suspected suicide is believed to contain ibuprofen and a solution of it in D2O is prepared and subjected to 1H NMR analysis. By reference to its chemical structure below identify the intensity, multiplicity and approximate chemical shift of each signal expected in the 1H NMR spectrum of the sample. You may use NMR parameters tables provided to assist you in your estimation of chemical shifts but you do NOT need to illustrate or explain the use you have made of parameter tables in your written answer, nor do you have to explain the splitting patterns you predict.

(C2) An unlabelled drug sample is believed to be paracetamol (structure below) and a sample of it is dissolved in D2O and subjected to 1H NMR analysis.

Using NMR parameter tables to help estimate chemical shifts wherever possible, deduce and sketch the spectrum that would be expected if the sample was indeed paracetamol. Show clearly the splitting patterns and relative intensities of each signal and explain any splitting patterns or other diagnostic or noteworthy features of the spectrum you sketch.
Section -B:
(A1) Predict the major fragment ions that might be observed for compound 3.

(A2) What mass spectrometry fragmentation reactions and products would you expect to observe for:
(i) a primary alcohol
(ii) the ether 1 (below)

Section -C:
1. Answer ALL parts of this question.
(a) Asymmetry factor (As) is used to determine the peak shape of compounds separated by chromatography. Indicate the As values for the following peak shapes:
i) fronting
ii) Gaussian (symmetrical)
iii) tailing
(b) What are the potential problems associated with split/splitless injection for gas chromatography (GC)?
(c) Why is it necessary to use a temperature programme in GC analysis of a complex mixture? Include in your answer a sketch of the chromatograms you would expect from the analysis under isothermal and temperature-programmed conditions.
Section -D:
(a) Two compounds were separated by HPLC using a 25-cm long column. The following information was obtained from the chromatogram via the computer output and the dead time was 1.68 min.
|
Peak number
|
Retention time (min)
|
Peak height
(mV)
|
Peak area (mV.min)
|
|
1
|
4.87
|
41120
|
54641
|
|
2
|
5.27
|
39122
|
45687
|
Calculate:
i) the separation factor (α) between these two peaks.
ii) the number of theoretical plates or column efficiency (N) for each peak.
iii) the height equivalent to a theoretical plate (H) for each peak
(b) Reversed phase and normal phase - high performance liquid chromatography (HPLC) are used to separate organic compounds of particular polarity. Compare the two methods with respect to stationary phase polarity, mobile phase polarity, and order of analyte elution.
(c) Examine the reasons for surface deactivation of silica-based C18 column in reversed phase - HPLC.
(d) What are the advantages and disadvantages of the ‘selected ion monitoring' mode for known compounds relative to ‘full scan' mode for data acquisition in HPLC-MS?
Section -E:
(A) In a chromatogram, the first analyte compound was eluted after 23.21 minutes and its peak width at the base was 14.8 seconds. Calculate the column efficiency or plate number (N).
What is the resolution (Rs) between this peak and a second peak eluted after 23.89 minutes with a width at the base of 15.3 seconds?
(B) Pressurised solvent extraction (PSE) is increasingly used for solid sample preparation prior to chromatographic analyses. Outline the operation of PSE and indicate typical working conditions.
(C) In a chromatogram, two compounds have retention times of 18.40 and 20.63 minutes, respectively using a 30 cm column. The peak widths at the peak bases are 1.11 and 1.21 minutes, respectively. Calculate:
i) The resolution (Rs) between the two peaks
ii) The column efficiency or plate number (N) of each peak
iii) The plate height (H) of each peak