Reference no: EM132546739
To begin:
• Download the Excel workbook M7A1_Fast_Decision_Models_V1.02 file [XLSX file, 15.4 KB]. Start Excel. Open the workbook and immediately save it with a new name. Use your name and include the assignment name, e.g Wright_Dawn_M7A1 (Last Name_First Name_M7A1). This will ensure you have a good copy in case you make mistakes. It will also make your instructor happy when grading your work, which is a good thing.
• Check to make sure the workbook calculations option is set to Automatic [Formulas tab > Calculation Options section > Automatic].
• The How to Do It videos are not meant to give you background and theory. They are intended to show only the very basics of the Excel process. Be sure you have read the assigned chapters and watched the required videos before you begin this assignment.
Outsourcing Decision
Connie Smith has asked you to develop some decision models to help her think through options for next year.
Fast can produce a part for their 1000 GB SSD internally or outsource its manufacture. Fast has simplified the decision as much as possible and identified all the costs that would result if they decide to manufacture the part in-house to two components: a Fixed Cost (FC) of setting up internal production of $50,000 and a Unit Variable Cost (UVC) of $125. Fast has also identified and calculated the unit cost of outsourcing the part, the Outsourcing Unit Cost (OUC), of $158. The decision comes down to the difference between the cost to manufacture, Total Manufacturing Cost (TMC), and the cost of outsourcing, Total Outsourcing Cost (TOC).
The key parameter is uncertain - the Demand (D). For high demand, the FC can be spread over more sales but for lower demand, the FC becomes a burden and it would be more economical to outsource the production of the part.
Question 1. Build a decision model to help Fast choose a path for production of the part. Demand has been estimated to be 1500 units. Find the difference (Delta = TMC - TOC) and recommend a decision as to "Manufacture" or "Outsource." Build your model using the basic framework for the decision model on the tab 1-Outsourcing Model in the Excel workbook you downloaded.
How to Do It: Decision Models in Excel
Make sure your model is complete and save your file.
Question 2. Fast believes keeping the internal production line open would have strategic value and is willing to "lose" $100,000 to do that. Copy your completed decision model from part 1 and paste it on the tab 2- Goal Seek.
How to Do It: Copy Model
Use your decision model with the initial values and Excel's What If Analysis tool Goal Seek to find the maximum the UVC could be without Delta exceeding $100,000.
How to Do It: Goal Seek
Make sure the final values found by your Goal Seek set up are visible in your model and save your file.
Question 3. Copy your completed decision model from part 1 and paste it on the tab 3-Data Table.
Use your decision model and Excel's What If Analysis tool Data Table to investigate the impact on Delta of the UVC varying in the range $85 through $155 with $10 increments, and the OUC varying in the range $100 through $250 with $25 increments. Use conditional formatting to highlight the data
table output as shown in the following video.
How to Do It: Data Table
Save your file when your Data Table is complete.
Question 4. Copy your completed decision model from part 1 and paste it on the tab 4-Scenario Manager. Use your decision model and Use Excel's What If Analysis tool Scenario Manager to capture and present as a Scenario Summary the results (Total Manufacturing Cost, Total Outsourcing Cost, Difference Delta, and the Decision) of the following alternative combinations:
|
Scenario
|
UVC
|
OUC
|
FC
|
|
1
|
$ 135.00
|
$ 155.00
|
$ 40,000.00
|
|
2
|
$ 110.00
|
$ 145.00
|
$ 60,000.00
|
|
3
|
$ 150.00
|
$ 150.00
|
$ 50,000.00
|
When properly set up, Scenario Manager will insert a new worksheet named Scenario Summary. Use the Name Manager as shown in the following video to name the changing cells and the results cells so your Scenario Summary is clearly labeled.
Save your file when your Scenario Summary is complete.
Question 5. Copy your completed decision model from part 1 and paste it on the tab 5-Solver. Use your decision model and Excel's Data tool Solver to find the values of the decision variables UVC, OUC, FC, and Demand which result in a maximum Delta. Use the values for UVC, OUC, FC, and Demand from the table below as constraints. Set the beginning values of the decision variables in your model to the minimum values in the table before you run Solver.
|
Constraints
|
Demand
|
FC
|
UVC
|
OUC
|
|
Minimum
|
2,500
|
$ 40,000.00
|
$ 100.00
|
$ 150.00
|
|
Maximum
|
4,000
|
$ 60,000.00
|
$ 145.00
|
$ 175.00
|
How to Do It: Enabling Solver in Excel 2016
How to Do It: Solver Basics
[Note: after you construct your Monte Carlo model in part f, Solver may slow down significantly. It is recommended you complete Part e before you build your Monte Carlo model.]
Question 6. Copy/recreate your completed decision model from part 1 on the tab 6-MonteCarlo in the space indicated. Modify your model using the Monte Carlo method and the following information: Background: Decision Models with Uncertainty
Note: for the following simulations, set the Formulas > Calculation Options to Automatic except for Data Tables. This will speed up your construction of Monte Carlo models. Use function key F9 to manually recalculate when desired.
a. Fast's data and marketing teams now believe the Demand for the part will increase to a normally distributed mean of 10,000 units with a standard deviation of 1000 units. Incorporate a normal distribution random variable for Demand in your decision model.
How to Do It: Normally Distributed Random Variable
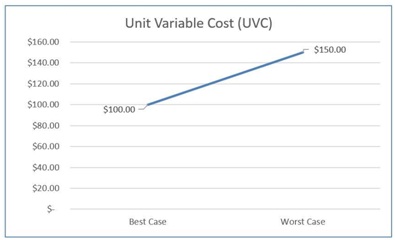
b. Fast's data team has discovered that the cost to manufacture the part internally actually varies. Their analysis shows the UVC follows a continuous uniform distribution with a worst- case cost of $150 and a best-case cost of $100. Incorporate a continuous uniform distribution random variable for UVC in your decision model.
How to Do It: Uniformly Distributed Random Variable
c. Fast's supplier has also had a data team working on their bid price (OUC). They have determined their cost to produce the part depends upon their volume of work (they sell the part to others besides Fast) and have provided the following discrete probability table of the price they would like to charge:
|
OUC Price
|
Probability
|
|
$ 105.00
|
0.1
|
|
$ 115.00
|
0.15
|
|
$ 125.00
|
0.18
|
|
$ 135.00
|
0.29
|
|
$ 150.00
|
0.18
|
|
$ 165.00
|
0.1
|
The supplier asks Fast to consider paying for the part based on these data. Being generous because of their long-term relationship to the supplier, Fast agrees to buy the part at the price indicated by use of the supplier table.
Incorporate a discrete probability random variable for Demand in your decision model.
How to Do It: Random Variable with Discrete Distribution
Question 7. Still on tab 6-MonteCarlo, run 1000 trials of the simulation using the Monte Carlo model you constructed in part 6. Note: the video shows only two random variables. Your decision model should have three random variables from part 6 and all three should be linked from the decision model to the data table. How to Do It: Basic Monte Carlo Simulation Data Table Construction
Question 8. Still on tab 6-MonteCarlo, create a properly formatted histogram (20 bins) of the frequency distribution of the difference Delta. The histogram should be dynamic (updates when the Monte Carlo
simulation is recalculated) and use color to differentiate between the columns representing bins with a Delta <0 and those with Delta >0.
How to Do It: Histogram using basic Excel functions
How to Do It: Making a Histogram Dynamic
Question 9. On tab 6-MonteCarlo, using the sample data from part 7,
a. Calculate the probability of difference Delta < 0
i. Do this using the "exact" simulation data, i.e. an Empirical probability.
ii. Do this assuming the distribution of difference Delta is approximately normal, i.e. use the mean and standard deviation of the difference Delta values.
b. Find the 95% normal distribution confidence interval around mean difference Delta.
c. Based on the results of your analysis of the simulation results, what is your recommendation for
Fast's decision to manufacture or outsource? Why do you recommend that?
d. Finally, Fast believes keeping the internal production line open would have strategic value and is willing to "lose" $100,000 to do that. Using the data from part 7, find the probability that Fast will lose more than $100,000 if they choose to keep the internal line operating instead of outsourcing the part?
How to Do It: Using Monte Carlo Simulation Output
Question 10. Organize and format your Excel file and worksheets to make it easy for Connie (and your instructor) to find and understand your work and results.
Attachment:- Student Instructions.rar