Reference no: EM131875044
Part -1:
Question 1) Suppose the demand for Digital Video Recorders (DVRs) is given by Q = 250 - .25p + 4pc, where Q is the quantity of DVRs demanded (in 1000s), p is the price of a DVR, and pc is the price of cable television. How much of a change in p must occur for Q to increase by one?
A) fall by 25¢
B) fall by $4
C) increase by 25¢
D) fall by $4.25
Question 2) An increase in the price of pork will lead to
A) a movement up along the demand curve.
B) a movement down along the demand curve.
C) a rightward shift of the demand curve.
D) a leftward shift of the demand curve.
Question 3) An increase in consumer incomes will lead to
A) a rightward shift of the demand curve for plasma TVs.
B) a movement upward along the demand curve for plasma TVs.
C) a rightward shift of the supply curve for plasma TVs.
D) no change of the demand curve for plasma TVs.
Question 4) The demand for pizzas in a large town is written as: Qd = 120 - 10P + 5Pb - 0.5Ps - 10Y, where Qd is the quantity demanded, P is the price, Pb is the price of burritos, Ps is the price of soft drinks sold in the pizza restaurants, and Y is personal income per month (in thousand dollars). If there is a $1,000 increase in personal income, how will the Qd
change?
A) increase by 10
B) decrease by 10
C) unchanged
D) not enough information provided
Question 5) Suppose the demand curve for a good shifts rightward, causing the equilibrium price to increase. This increase in the price of the good results in
A) a rightward shift of the supply curve.
B) an increase in quantity supplied.
C) a leftward shift of the supply curve.
D) a downward movement along the supply curve.
Question 6) A rise in the oil price will
A) shift the supply curve of gas to the left.
B) shift the supply curve of gas to the right.
C) leave the supply curve of gas unchanged.
D) not enough information.
Question 7) Suppose the inverse demand curve for a good is expressed as Q = 50 - 2p. If the good currently sells for $3, then the price elasticity of demand is
A) -3 * (2/50).
B) -2 * (50/3).
C) -2 * (3/44).
D) -3 * (44/2).
Question 8) If the demand function for orange juice is expressed as Q = 2000 - 500p, where Q is quantity in gallons and p is price per gallon measured in dollars, then the demand for orange juice has a unitary elasticity when price equals
A) $0.
B) $1.
C) $2.
D) $4.
Question 9) If the demand for orange juice is expressed as Q = 2000 - 500p, where Q is measured in gallons and p is measured in dollars, then at the price of $3, the demand curve
A) is elastic.
B) has a unitary elasticity.
C) is inelastic.
D) is perfectly inelastic.
Question 10) If the price of orange juice rises 10%, and as a result the quantity demanded falls by 8%, the price elasticity of demand for orange juice is
A) -1.25.
B) elastic.
C) Both A and B above.
D) Neither A nor B above.
Question 11) Which of the following is most likely to be true?
A) Income elasticity of demand for fur coats exceeds that of oatmeal.
B) Income elasticity of demand for oatmeal exceeds that of fur coats.
C) Income elasticity of demand for fur coats equals that of oatmeal.
D) It is not possible to make any prediction about relative income elasticities.
Question 12) If a good has an income elasticity of demand greater than one, one might classify that good as
A) a necessity.
B) a luxury.
C) unusual.
D) inelastic.
Question 13) The cross price elasticity of demand between two goods will be positive if
A) the two goods are complements.
B) the two goods are substitutes.
C) the two goods are luxuries.
D) one of the goods is a luxury and the other is a necessity.
Question 14) The price elasticity of supply when the supply curve is Q = 5 is
A) 5.
B) perfectly inelastic.
C) perfectly elastic.
D) Cannot be calculated from the information provided.
Question 15) In the mid-1980s, the salaries of accounting professors with Ph.D.s increased dramatically. This resulted in an increase in enrollments in Ph.D. accounting programs. Since a Ph.D. degree in accounting may take at least four years to complete, the short-run elasticity of supply of accounting professors is
A) greater than the long-run-elasticity of supply.
B) less than the long-run elasticity of supply.
C) equal to the long-run elasticity of supply.
D) equal to the short-run elasticity of demand.
Question 16) Relative to the short-run demand for gasoline, the long-run demand for gasoline is
A) probably more elastic since people need time to change automobiles and driving habits.
B) probably less elastic since people need time to change automobiles and driving habits.
C) probably more elastic because people can hoard this good.
D) probably less elastic because people cannot store this good.
Question 17) Suppose the supply curve and the demand curve both have unitary elasticity at all prices. The price increase to consumers resulting from a specific tax of $1 imposed on sellers will be
A) $1.
B) 50 cents.
C) zero.
D) impossible to calculate without knowing the slope of the supply curve.
Question 18) Consumers will always pay the entire amount of a specific tax whenever
A) demand is perfectly inelastic.
B) supply is perfectly elastic.
C) Both A and B above.
D) Either A or B above but not at the same time.
Question 19) If a government wants to maximize revenues from a tax, it should
A) impose it on sellers.
B) impose it on consumers.
C) choose a good with a relatively elastic demand.
D) choose a good with a relatively inelastic demand.
Question 20) Suppose the demand curve for a good is downward sloping and the supply curve is upward sloping. At the market equilibrium, if demand is more elastic than supply in absolute value, a $1 specific tax will
A) raise the price to consumers by 50 cents.
B) raise the price to consumers by less than 50 cents.
C) raise the price to consumers by more than 50 cents.
D) raise the price to consumers by $1.
Question 21) Suppose the market for grass seed can be expressed as:
Demand: QD = 100 - 2p
Supply: QS = 3p
At the market equilibrium, calculate the price elasticities of supply and demand. Use these numbers to predict the change in price resulting from a specific tax.
Question 22) Suppose the market for corn is given by the following equations for supply and demand:
QS = 2p - 2
QD = 13 - p
where Q is the quantity in millions of bushels per year and p is the price.
a. Calculate the equilibrium price and quantity. Sketch the supply and demand curves on a graph indicating the equilibrium.
b. If a price floor is imposed at $7 per bushel, will there be a surplus or a shortage? What is the quantity of excess supply or demand that results? Draw a graph to show this.
Part - 2:
Question 1) Producer surplus is equal to
A) the area under the supply curve.
B) the difference between price and average cost for all units sold.
C) the difference between price and marginal cost for all units sold.
D) the firm's profit when fixed costs exist.
Question 2) Suppose the market supply curve is p = 5 + Q. At a price of 10, producer surplus equals A) 50.
B) 25.
C) 12.50.
D) 10.
Question 3) Advocates of steel tariffs to protect American steel firms realize that when imposing such tariffs the gains of firms are outweighed by the losses to consumers. This implies that
A) such advocates value producer surplus more than consumer surplus.
B) such advocates want to help consumers.
C) such advocates value consumer surplus more than producer surplus.
D) such advocates value producer surplus and consumer surplus equally.
Question 4) If in a market the last unit of output was sold at a price higher than marginal cost,
A) producers are better off producing more.
B) consumers are better off if less of the product is sold.
C) social welfare is not maximized.
D) the unit increased total profit.
Question 5) Deadweight loss occurs when
A) producer surplus is greater than consumer surplus.
B) the maximum level of total welfare is not achieved.
C) consumer surplus is reduced.
D) an inferior good is consumed.
Question 6) (True or False) While producing less than the competitive output decreases social welfare, the same cannot be said about producing more than the competitive output. (explain)

Question 7) The above figure shows supply and demand curves for apartment units in a large city. If the city government passes a law that establishes $350 per month as the legal maximum rent, the loss in social welfare equals
A) b + c.
B) f.
C) a.
D) f + g.
Question 8) The above figure shows supply and demand curves for apartment units in a large city. If the city government passes a law that establishes $350 per month as the legal maximum rent, the consumer's net gain in surplus equals
A) c - f.
B) b - f.
C) d - f.
D) The answer cannot be determined from the information given.
Question 9) The above figure shows supply and demand curves for apartment units in a large city. If the city government passes a law that establishes $350 per month as the legal maximum rent, producer surplus
A) increases.
B) decreases.
C) stays the same.
D) changes in a direction that cannot be determined from the information given.
Question 10) The above figure shows supply and demand curves for apartment units in a large city. If the city government passes a law that establishes $350 per month as the legal maximum rent, producer surplus decreases by
A) d.
B) b + f.
C) c + g.
D) i.
Question 11) The above figure shows supply and demand curves for apartment units in a large city. If the city government passes a law that establishes $350 per month as the legal maximum rent, producer surplus will be
A) d.
B) d + e.
C) d + g.
D) d + c + g.
Question 12) The above figure shows supply and demand curves for apartment units in a large city. If the city government passes a law that establishes $450 per month as the legal maximum rent, consumer surplus will be
A) a.
B) a + b + f.
C) a + b + c.
D) a + b + c + f + g.
Question 13) The above figure shows supply and demand curves for apartment units in a large city. The area "c" represents
A) the loss in consumer surplus if a rent ceiling of $350 is imposed.
B) a transfer from producers to consumers if a rent ceiling of $350 is imposed.
C) a transfer from consumers to producers if a rent ceiling of $350 is imposed.
D) the total revenue received by supplying Q1 units.
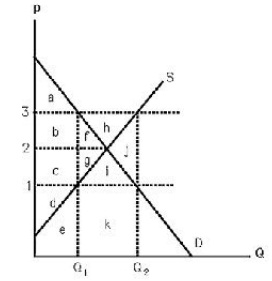
Question 14) The above figure shows supply and demand curves for milk. In an effort to help farmers, the government passes a law that establishes a $3 per gallon price support. To maintain the price support, government expenditures must equal
A) k + i.
B) f + g + h + i + j.
C) f + g + h + i + j + k.
D) f + g + h + i + j + k + e.
Question 15) The above figure shows supply and demand curves for milk. In an effort to help farmers, the government passes a law that establishes a $3 per gallon price support. To maintain the price support, government must purchase
A) Q1 gallons.
B) Q2 gallons.
C) Q1 - Q2 gallons
D) Q2 - Q1 gallons.
Question 16) The above figure shows supply and demand curves for milk. In an effort to help farmers, the government passes a law that establishes a $3 per gallon price support. As a result, consumer surplus falls by
A) a.
B) b + f.
C) f + g.
D) b + f - c.
Question 17) The above figure shows supply and demand curves for milk. In an effort to help farmers, the government passes a law that establishes a $3 per gallon price support. The loss in social welfare resulting from this price support equals
A) k + i.
B) j.
C) [$3 * (Q - Q1 )] - h.
D) $3 * k.
Question 18) The above figure shows supply and demand curves for milk. If the government passes a $2 per gallon specific tax, the loss in social welfare will equal
A) b + c + f + g.
B) f + g.
C) b + f.
D) c + g.
Question 19) Tariffs and quotas create a loss in social welfare because
A) producer surplus declines.
B) revenues from tariffs are misspent.
C) consumer surplus declines.
D) All of the above.
Question 20) The welfare loss from an import quota is greater than that of an equivalent tariff because
A) tariff revenues can be used to society's benefit.
B) the loss in consumer surplus is not as large.
C) domestic producers gain more from a quota than from a tariff.
D) tariff revenues represent an additional deadweight loss.
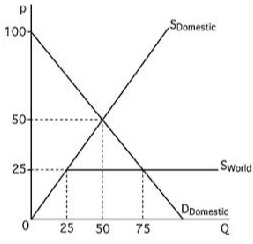
Question 21) The domestic demand curve, domestic supply curve, and world supply curves for a good are given in the above figure. All the curves are linear. Initially, the country allows imports. Then imports are banned. Calculate how consumer and producer surplus change because of the ban. Is the country better off with the ban on imports? Why?
Question 22) Explain why a government would impose an import tariff when domestic consumers suffer more than producers gain.
Part - 3:
Question 1) An indifference curve represents bundles of goods that a consumer
A) views as equally desirable.
B) ranks from most preferred to least preferred.
C) refers to any other bundle of goods.
D) All of the above.
Question 2) Convexity of indifference curves imply that consumers are willing to
A) give up more "y" to get an extra "x" the more "x" they have.
B) give up more "y" to get an extra "x" the less "x" they have.
C) settle for less of both "x" and "y".
D) acquire more "x" only if they do not have to give up any "y".
Question 3) Measuring "y" on the vertical axis and "x" on the horizontal axis, convexity of indifference curves imply that the MRS of "y" for "x"
A) is decreasing as "x" increases.
B) is increasing as "x" increases.
C) is constant as "x" increases.
D) cannot be calculated for large levels of "x".
Question 4) Diminishing marginal rate of substitution can be seen when indifference curves
A) cross.
B) are convex.
C) are downward sloping.
D) become flatter as we move down and to the right.
Question 5) For which of the following pairs of goods would most people likely have convex indifference curves?
A) nickels and dimes
B) left shoes and right shoes
C) movie tickets and concert tickets
D) None of the above.
Question 6) (True or False) Indifference curves for perfect substitutes must be parallel lines with a slope of negative one. (explain)
Question 7) If two bundles are on the same indifference curve, then
A) the consumer derives the same level of utility from each.
B) the consumer derives the same level of ordinal utility from each but not the same level of cardinal utility.
C) no comparison can be made between the two bundles since utility cannot really be measured.
D) the MRS between the two bundles equals one.
Question 8) If the utility function (U) between food (F) and clothing (C) can be represented as U = √(F.C), the marginal rate of substitution of clothing for food will if more food and less clothing are consumed.
A) increase in absolute terms
B) decrease in absolute terms
C) remain the same
D) Not enough information.
Question 9) If Fred's marginal utility of pizza equals 10 and his marginal utility of salad equals 2, then
A) he would give up five pizzas to get the next salad.
B) he would give up five salads to get the next pizza.
C) he will eat five times as much pizza as salad.
D) he will eat five times as much salad as pizza.
Question 10) (True or False) The absolute value of the slope of an indifference curve equals the ratio of the marginal utilities of the two goods involved. (explain)
Question 11) Teddy has preferences given by the utility function U(K,L) = 2L + K where K = pounds of Kale per month and L = pounds of lettuce per month. What is Teddy's Marginal Utility of Kale? What is Teddy's Marginal Utility from Lettuce? If Kale is on the horizontal axis, what is Teddy's marginal Rate of Substitution?
Question 12) Joe's income is $500, the price of food (F) is $2 per unit, and the price of shelter (S) is $100. Which of the following represents his budget constraint?
A) 500 = 100F + 2S
B) 500 = 2F + 100S
C) S = 500 - 2F
D) All of the above
Question 13) Joe's budget constraint equals 500 = 2F + 100S, where $500 is Joe's income, $2 is the price of food (F) and $100 is the price of shelter (S). How much food can Joe buy if he buys one unit of shelter?
A) two units
B) 200 units
C) 250 units
D) 400 units
Question 14) Joe's income is $500, the price of food (F) is $2, and the price of shelter (S) is $100. Which of the following bundles is in Joe's opportunity set?
A) 50 units of food, five units of shelter
B) 200 units of food, two units of shelter
C) 100 units of food, one unit of shelter
D) 150 units of food, three units of shelter
Question 15) The rate at which a consumer must give up y to get one more x is equal to
A) -Px /Py .
B) -Py /Px .
C) -MUx /MUy.
D) MUy /MUx.
Question 16) If the price of one good increases while the price of the other good and the consumer's income remain unchanged, what will happen to the budget line?
A) The budget line rotates inward from the intercept on the axis of the good that did not change in price.
B) The budget line rotates outward from the intercept on the axis of the good that did not change in price.
C) The budget line shifts inward without a change in slope.
D) The budget line shifts outward without a change in slope.
Question 17) Explain the difference between the marginal rate of substitution and the marginal rate of transformation.
Question 18) (True or False) If MRS > MRT, then the consumer is better off than at equilibrium. (explain)
Question 19) Jane's utility function is represented as: U = F0.5 C0.5, F is quantity of food and C is quantity of clothing. If her budget constraint is represented as: 120 = 2F + C, her optimal bundle of consumption should be
A) (40F, 40C).
B) (20F, 60C).
C) (50F, 50C).
D) (45F, 20C).
Question 20) Lisa consumes only pizzas (P) and burritos (B). Her utility function is U = P0.5B0.5 $10 and the price per burrito is $5. In equilibrium, Lisa consumes four pizzas. Using Lisa's utility function, calculate how many burritos she consumes.
Question 21) Consider Jen, a consumer with preferences U(H,F) = F1/3H2/3, where H is the quantity of housing and F is the quantity of food (per month). Suppose Jen has a stipend of $600/month which she uses to purchase food at a price of $1/unit and housing at a price of $10/unit.
a. Compute Jen's utility-maximizing bundle of goods.
b. Suppose that Jen's employer subsidizes housing by paying 50% of her total housing costs, thereby effectively lowering the price Jen pays for housing to $5/unit. Compute Jen's new optimal consumption bundle.
c. How much does Jen's employer pay in total for this subsidy? How much utility does Jen enjoy with this subsidy
(compute her utility at the optimal bundle).
d. Suppose that her employer simply gave Jen the dollar cost you found in (c) as a lump sum (instead of subsidizing housing). Will Jen gain a higher utility from the housing subsidy or the lump-sum equivalent transfer?