Reference no: EM132681040
Question 1: The gestation period for human births can be taken as normally distributed with a mean of 266 days and a standard deviation of 16 days
1. What is the probability that a randomly chosen baby hao a gestation period of more than 275 days,
2. If a gestation penod is 281 days, what percentile among human births is this
Question 2: A researcher is examining the impact of exposure to traumatic events on recovery in people with a history of opioid addiction. The following are lifetime trauma exposure scores measured in 10 individuals who are are in recovery from opioid dependence. Trauma scores are based on a validated scale, and range from 0 to 10.
9, 7. 9. 3, 7, 9. 6. 6. 7. 3
1. Generate a 95% confidence interval estimate of the true trauma score.
2. Interpret your results in 1-2 sentences, using the example Cl language from Sullivan
Question 3: Assume that body mass index (BMI) in children is approximately normally dismbuled teeth a mean of 26-1 and a stamart deviation of 6.1. Answer the follawing questions
1. A BM between 25 and 30 is considered overweight What proporbon of children are overweight?
2. A BMI of 30 or more is considered obese. What proportion of children are obese
3. in a random sample of 10 children. what is the probability that their mew BMI exceeds 25?
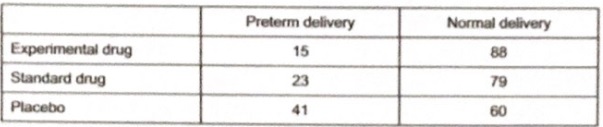
Question 4: Using the date below genrate a 95% confidence interval for the proportion of women in the experiment treatment group who delivered preterm compared to normal delivery.
Question 5: A recent study reported that the prevalence of osteoporosis among women age 65 and over is 24.5%. If 15 women are analyzed;
1. What is the probability that at least two of these women have osteoporosis?
2. Among these women, how many would be expected to have osteoporosis?
Question 6: In your own words, explain the role of the Central Limit Theorem in allowing us to calculate confidence intervals for samples of data that are not normally distributed, such as dichotomous data.
You should be able to explain this in one paragraph, but feel free to write more if you wish
Question 7: Three hundred seventy eight patients were diagnosed according to the type of skin cancer and the location of the skin cancer Use the data presented below to answer the following
|
|
Location
|
|
|
Type
|
Head and Neck
|
Trunk
|
Extremities
|
Total
|
|
Hutchinson's melanomic freckle
|
22
|
2
|
8
|
32
|
|
Indeterminate
|
11
|
17
|
23
|
51
|
|
Nodular
|
19
|
33
|
73
|
125
|
|
Superficial spreading melanoma
|
16
|
49
|
105
|
170
|
|
Total
|
68
|
101
|
209
|
378
|
1. What proportion of patients had superficial spreading melanoma?
2. Of patients with a skin cancer on the trunk, what proportion had a nodular skin cancer?
3. What proportion of patients had nodular skin cancer on the head and neck?
4. What proportion of patients with skin cancer on the extrerneties had a Hutchinson's melanomic freckle?
5. Is type of skin cancer independent of location? Justify your answer using quantitative methods.
Question 8: As a follow-up to the study in question 8, the researcher collects data about the impact of exposure to traumatic events on recovery in people with a history of alcohol abuse. She wishes to compare their trauma scores to those from the original sample of people with a history of °piaci addiction (data in question 8). The data below are from the alcohol-history sample.
5, 2, 7, 1, 1, 5, 4, 3, 0, 4
1. Generate a 95% CI for the difference in means between the opioid addiction group and the alcohol-history group
2. In 1-2 sentences. interpret your results using the example CI language from Sullivan
3. In 1-2 sentences, explain why you believe that these groups do or do not have significantly different trauma history
Question 9: The following table shows the results of a nested case-control study designed to investigate the association between coffee drinking and PMS symptoms among women age 25-40 years.
|
|
PMS symptoms
|
No PMS symptoms
|
|
High coffee intake
|
131
|
112
|
|
Low coffee intake
|
48
|
91
|
1. Calculate the odds that women without PMS symptoms had low coffee intake
2. Calculate the odds ratio (OR) for the association between coffee intake and PMS symptoms.
3. Interpret your odds ratio result in 1-2 sentences.