Reference no: EM132281687
Assignment - Principles of Statistical Inference (PSI)
Question 1 - In a clinical study, the required sample size has been calculated to be a known constant k. The number of eligible participants who need to be invited to join the study in order to achieve this sample size can be described by a random variable with a negative binomial distribution.
In study i with target sample size ki the number who need to be invited is described by Xi
Xi ∼ NB(ki, p)
Pr(Xi = xi) = (xi - 1)!/((ki-1)!(xi-k)!)pk_i(1-p)x_i -K_i
for ki = 1, 2, . . . an dxi = ki, ki + 1, ki + 2, ... and 0 < p ≤ 1
where p is the probability of successful recruitment for each eligible participant (same in all studies), and
E(Xi) = ki/p
The investigators are interested in estimating the parameter p and have gathered data for a number n of recent studies in this population. Answer the following questions in general terms:
a) Write down the likelihood L(p) for the sample of n studies.
b) Calculate the log-likelihood l(p), omitting all terms that do not depend on the parameter p.
c) Calculate the maximum likelihood estimator (MLE) for parameter p.
d) Calculate the observed information IO(p).
e) Calculate the expected information I(P).
f) Calculate the standard error of the MLE.
g) Give the formula for the 95% confidence interval for the parameter.
The investigators have identified n = 7 suitable studies and have retrieved the following data:
|
Study
|
Invited
|
Recruited
|
|
1
|
148
|
108
|
|
2
|
162
|
113
|
|
3
|
165
|
108
|
|
4
|
144
|
101
|
|
5
|
208
|
156
|
|
6
|
285
|
199
|
|
7
|
202
|
149
|
|
Total
|
1314
|
934
|
h) Substitute in the data to evaluate the MLE, the expected information, the standard error and the 95% confidence interval for the MLE for these data.
i) The next study to be undertaken requires k = 126 participants. Estimate the expected number k/p of participants who will need to be invited in order to recruit 126 participants and calculate a 95% confidence interval for the estimate.
Question 2 - Patients with advanced cancer are often offered palliative chemotherapy with the aim of controlling pain and improving quality of life. Patient-rated pain scores can be measured in a variety of ways and are often assumed to follow a normal distribution. Due to possible side-effects, cost and inconvenience, this intervention is only considered worthwhile if it can decrease an individual's pain score by at least 8 points.
Assume that we will perform a one-sided hypothesis test at 5% significance level. Due to the heterogeneous population who may be recruited into the study responses to treatment are very variable. Assume that the (between-patient) standard deviation of the reduction in pain score (the within-patient difference: score before treatment - score after treatment) is expected to be approximately 37.
a) How many patients are required in the study if a power of 80% is desired and we want to detect a mean reduction of 8?
b) Write down an expression for the power, in terms of the sample size (n) and the mean reduction in pain scores to be detected (d). Assuming 126 patients are available for the study, what power is achieved to detect a mean pain score reduction of 8?
c) Write down an expression for the detectable difference (d), in terms of the sample size and the power. Assuming 126 patients are recruited for the study but 7 of them withdraw before their final pain scores can be recorded, what reduction in pain score can be detected with a power of 80% in the remaining patients?
d) Suppose that it is anticipated that D% of patients will not actually receive the therapy for reasons unrelated to their disease. Under the "intention-to-treat" principle, such patients will still be included in the analysis. Suppose also that the mean pain score reduction is d in patients who do receive chemotherapy, and is 0 in patients who do not receive chemotherapy.
a. What is the mean pain score reduction in a population in which D% of the patients do not receive chemotherapy?
b. Hence write down an expression for the sample size as a function of the desired power, the mean pain score reduction d, and the percentage of patients who do not receive chemotherapy D.
c. By what factor would you need to inflate the sample size in part a, to account for an expected 10% of patients not receiving chemotherapy?
Question 3 - In a randomised study, a physiotherapist investigates whether training improves endurance time in participants performing a repeated lifting task. This experiment is used to simulate a work situation where workers are routinely doing a manual task above shoulder level. The endurance time is the time for which a participant can continue to carry out the task without stopping. As the task is relatively tiring - it consists of lifting a box weighted with 66% of the maximum weight a participant can carry - investigators measure the time until a volunteer stops because of musculoskeletal fatigue or pain. Participants are randomised to the two arms of the study, the intervention group (training) or the control group (no training).
Let Yi, i = 1, . . . , n1 denote the endurance times in the control arm and Zi, i = 1, . . ., n2 the times in the intervention arm. We assume that the observations come from an exponential distribution with parameter λ1 in the control group and parameter λ2 in the intervention group.
This is, Yi, i = 1, . . . , n1 have density:
f(yi) = λ1 exp(-λ1yi) for yi ≥ 0 and 0 otherwise.
and Zi, i = 1, . . . , n2 have density:
f(zi) = λ2 exp(-λ2zi) for zi ≥ 0 and 0 otherwise
a) Write down the joint log-likelihood function for the parameters λ1 and λ2.
b) Show that the group means Y- and Z- are jointly sufficient statistics for λ1 and λ2.
c) Write down the two likelihood equations.
d) Solve the equations to determine the maximum likelihood estimators λ^1 and λ^2 for the parameters in the two populations.
e) Determine, in terms of λ1 and λ2:
f) the observed information matrix,
g) the expected information matrix (make sure you justify this step),
h) its matrix inverse.
The investigators are interested in the median duration time in both arms. The investigators have randomised 126 participants and the sample sizes in the two arms are equal. The median time to an event for an exponential distribution with parameter λ is log(2)/λ.
The sample means in the endurance study are y- = 401 seconds and z- = 685 seconds.
- Propose an estimate of the median endurance time in each population.
- What principle are you using to allow you to do this?
- Evaluate the two estimates using the data provided.
i) Using (d) and (e), obtain 95% confidence intervals for both λ^1 and λ^2. Derive the 95% confidence intervals for the two median endurance times by transforming the previous confidence intervals.
j) Based on your answers to (f) and (g) can we conclude that the intervention was effective? Justify your answer using only the information in the question.
k) Assuming that randomisation makes the two arms similar with respect to all potential predictors, what would be the effect of training in minutes?
Recall that the inverse of a 2×2 matrix is obtained as follows:
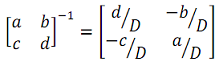
Where D = ad- bc
And (hint!) in this example you should find that b = c = 0.