Reference no: EM1319911
"This is too strange," is the thought that runs through your mind. The Harry Hines Medical Center's (HHMC) Board of Directors just informed you that it wants you to evaluate HHMC's managed care plan for professional astrologers. Apparently, the board thinks that the number of patient days used by astrologers in the plan might be influenced by the number of sunspots in a given month & wants you to investigate this question. The board collected the following eight months of data:
|
Month
|
Number of Sunspots
|
Patient Days
|
|
Jan
|
12
|
781
|
|
Feb
|
31
|
758
|
|
Mar
|
23
|
1,033
|
|
Apr
|
36
|
998
|
|
May
|
55
|
1,593
|
|
Jun
|
42
|
1,223
|
|
Jul
|
18
|
1,322
|
|
Aug
|
33
|
1,190
|
Returning to the office, you put the data into a MS-Excel spreadsheet and regress Patient Days (the dependent variable) on Number of Sunspots (the independent variable).
However, just as you start printing the results a power surge occurs -- somehow you suspected this might happen -- and you get the following (somewhat) garbled printout.
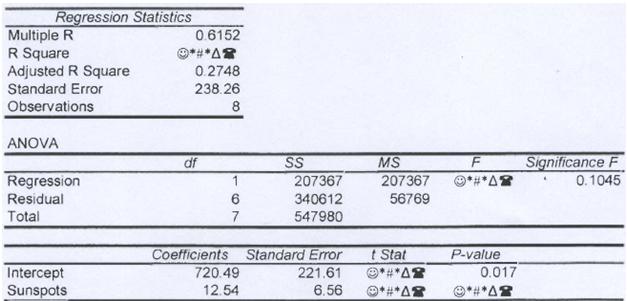
[A] Calculate the missing R-square statistic.
[B] What is the value of the correlation coefficient between sunspots & astrologer patient days?
[C] Calculate the missing t-statistic on the output for the coefficient of sunspots.
[D] Suppose the two-tail p-value = 0.105 for the t-statistic in the prior question. Using a Type-I error rate of 5%, is the coefficient of sunspots significantly different from zero?
(a) Explain your answer to part 'h' above using a picture.
(b) Calculate the missing F-Ratio.
[E] Assume that the F-Ratio = 5.99 in the prior question. Use the F-table in the back of the ook to find the upper the one-tail p-value?
a) Write the regression equation.
[E] What does the regression equation predict for the number of astrologer patient days given that the number sunspots is expected to be 40?
[F] What does the regression equation predict for the number of patient days given the number sunspots is zero? Explain why this is, or is not, a reasonable prediction.
[G] In the prior question, assume the missing t-statistic = 2.0 for the coefficient of sunspots. Use a t-test with df = 6 to test the null hypothesis that the coefficient is zero using a Type-I error rate of 5% (i.e., alpha = 0.05). Show all parts of the test & state your conclusion.
|
Test hypothesis using data
: A writing an article about call centre working conditions a reporter has claimed that the average tenure is no more than two years. Formulate and test a hypothesis using these data to determine if this claim can be disputed.
|
|
What will be the total kinetic energy
: A lead ball is dropped into a lake from a diving board 5 above the water. After entering the water, it sinks to the bottom with the constant velocity equal to the velocity with which it hit the water. The ball reaches the bottom 3.20 after it is f..
|
|
Determine the distance and direction from lake b
: How to compute for the density of dark matter estimate mass density of dark matter in the solar neighbourhood. Express the answer in units of kg m-3, Msun pc-3, Msun AU-3.
|
|
Test of significance for average salary
: If the city manager knows the average salary nationally is $38,300, which test of significance should be used? Why?
|
|
Calculate the missing r-square statistic
: Calculate the missing R-square statistic.
|
|
Compute the tension in the rope
: A gymnast of mass 60kg hangs from a vertical rope attached to the ceiling. You can ignore the weight of the rope and assume that the rope does not stretch. Use the value 9.81 for the acceleration of gravity.
|
|
Comparing relationship between iv and dv
: Which measure of association would the researcher use to compare the relationship between the IV and DV? Why?
|
|
Find the web site for roi institute
: Use a search engine of your choice and find the web site for ROI Institute, Inc. Once you have found the website, click on "Tool," and review the "Nations Hotels-Measuring the ROI in Business Coaching."
|
|
What speed does truck after that strike the tree
: A 2kg lunchbox is sent sliding over a frictionless surface, in positive direction of an x axis along the surface. Start at time t = 0, steady wind pushes on the lunchbox in the negative direction of the x axis.
|