Calculate the mean of the sample values

Assignment Help Electrical Engineering
Reference no: EM133155952

Statistical Process Control

Control Charts

Question 1. Describe how to assess the capability of any process to meet its requirements and stay within predefined specification limits.

State the different choices of control chart available and the preferred system used by the process industries.

Question 2. For a given process, the upper specification and lower specification limits are set at 2.549 and 2.503 respectively. If the standard deviation for this process is 0.0036 and the mean is 2.530, calculate the following indices.

(i) Process capability index Cp.
(ii) Process capability index Cpk.

Using your results, make recommendations as to whether this process is capable, and likely to meet its specification requirements. What are the relative advantages of the two types of process capability index?

Question 3. (a) In the event of a process being found to be incapable, what remedial action should be taken to bring it back within specification limits?

State the two types of causes of variations occurring in a process and provide a brief description of each.

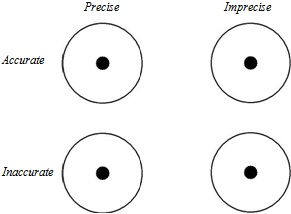
(b) Mark up the diagram opposite, using a pattern of dots in each case, to show the differences between "precise/imprecise" and "accurate/inaccurate" in SPC work.
1162_Control chart.jpg

Question 4. (a) Write an equation defining the Relative Precision Index.

(b) Two sets of components are being made. Inspection sample size is 4.

For set (1), the Total Specification Tolerance is 0.10 mm, and the average range is 0.05 mm.

For set (2), the Total Specification Tolerance is again 0.10 mm but the average range is 0.02 mm.

Calculate the Relative Precision Index in each case and, from the table on the following page, state the relative precision for each group.

Sample

Value of RPI


Size


Low Relative

Medium Relative

High Relative


Precision

Precision

Precision


2

< 6.0

6.0 - 7.0

> 7.0


3

< 4.0

4.0 - 5.0

> 5.0


4

< 3.0

3.0 - 4.0

> 4.0


5 or 6

< 2.5

2.5 - 3.5

> 3.5


Question 5. Control chart systems can operate on two basic methods of measurement. State these two methods and briefly distinguish between them, giving three examples of industrial processes where each might be applied. Specify an appropriate sampling procedure in each case.

Question 6. (a) Write a brief note stating the circumstances under which cusum charting may be preferable to normal Shewart charting methods.

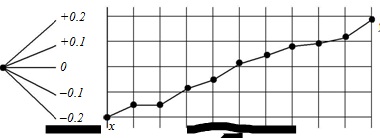
(b) Calculate the mean of the sample values below, and suggest a suitable value for k, the cusum reference value.

2.07 2.03 1.99 1.99 2.01 2.00 2.05 2.02

(c) Using the chosen value of k and referring to the cusum chart below, state the process mean between the points x and y.
2324_Charting methods.jpg


Question 7. In a manufacturing process, the following data is obtained after examining 10 samples, each of 6 items.

Sample


1


2


3


4


5


6


7


8


9


10

number

Range

0.09

0.08

0.10

0.11

0.12

0.08

0.13

0.08

0.09

0.12

Using this data and the information given below, design and sketch an average control chart, showing upper and lower design limits, upper and lower action limits, and nominal value. Calculate and state the range control limit value.

Nominal size = 12.00 mm, tolerance ± 0.15 mm, Take A′′0.025 = 0.90 and D′0.001 = 2.21.

Question 8. Comment on the production control situations depicted by the four control charts shown on the following page, and state what action, if any, would be necessary in each case.

Attachment:- Control Charts.rar

Reference no: EM133155952

Questions Cloud

Describe how you will go about learning from others : Describe how you will go about learning from others after this module. What are the costs of not learning from others? What might you seek to learn from others
Produce a short report to update your manager : Produce a short report to update your manager on both the method and results of your analysis and the introduction od Six Sigma
How to negotiate successfully : You applied for a Marketing Director position at ABC Corporation in Miami, Florida. You received a call from the hiring manager that you have been considered fo
Forms of non-verbal communication : These are questions about Public and Media Relations. Please choose the correct answer and explain the reason briefly.
Calculate the mean of the sample values : Calculate the mean of the sample values below, and suggest a suitable value for k, the cusum reference value
Putting quality into practice : Quality Improvement is an important concept in process redesign. It is important that you see examples of successful application of Quality Improvement in the h
Influence the costs of doing business in country : Outline why the culture of a country might influence the costs of doing business in that country. Illustrate your answer with examples.
Identify a microentrepreneur in grenada west indies : Identify a microentrepreneur in Grenada West Indies. Outline two reasons why they may need a loan for their business and also document two challenges in providi
Calculate the range and the arithmetic mean : Calculate the median for the group of results tabulated and Calculate the range and the arithmetic mean for the set of data

Reviews

Write a Review

Electrical Engineering Questions & Answers

  Lithium ion battery technology

The paper includes Lithium ion battery technology with its advantages and disadvantages. The paper discusses about the Lithium air battery in which detailed reactions of Lithium with air including nonaqueous as well as aqueous are given.

  Power transformers and tariffs

Construction of different types of power transformer, significant energy savings

  Paper on orthogonal frequency-division multiplexing

This document is shown a paper on Orthogonal frequency-division multiplexing with advantages, disadvantages and uses.

  Function of the hmi in a scada system

This assignment contains electronics engineering questions like State the commonly found components of a SCADA (Supervisory control and data acquisition) system. and decribe the function of the HMI in a SCADA system.

  Resultant waveform of the odd harmonic series

Prepare an Excel graph showing the individual components and summated resultant waveform of the odd harmonic series resulting in an approximate square wave.

  Explain scada system

Explain the function of the HMI in a SCADA system.

  Design a 2-digit 24 second shot-clock

Design a 2-digit 24 second "shot-clock" countdown timer with pushbutton controller.

  Model a discrete-time system

To understand di erent signal models To be able to model a discrete-time system and design simple signal processing algorithms.

  Draw a relay construction diagram

Draw a relay construction diagram and briefly explain the operation of a relay.

  Frequency division multiplexing

Write a short technical report on Frequency Division Multiplexing

  Impact of electron energy

Briefly discuss the impact of electron energy, electron current and target on the Bremsstrahlung generated.

  Traffic light controller

The schematic of the traffic light controller

Free Assignment Quote

Assured A++ Grade

Get guaranteed satisfaction & time on delivery in every assignment order you paid with us! We ensure premium quality solution document along with free turntin report!

All rights reserved! Copyrights ©2019-2020 ExpertsMind IT Educational Pvt Ltd