Calculate the mean and standard deviation for the four sets

Assignment Help Basic Statistics
Reference no: EM13884200

Presentation and interpretation of data.

For this assignment you will be marked on your presentation and interpretation of the data given to you. At all levels of communication, the easiest way to present your ideas or results is to do so clearly, neatly, and in a uniform manner. Your aim is to guide the reader into accepting your interpretation of the data.

To make a graph, keep the following basic steps in mind.

• Assign which variable to plot on the x-axis (typically independent) and y-axis (typically dependant).

• Assign a minimum and maximum on each axis to incorporate your minimum and maximum values.

• Plot the data and make it as visually simple as possible.

• Give the graph a title.

Below is an example of a completed figure.

1795_Presentation and interpretation of data.png

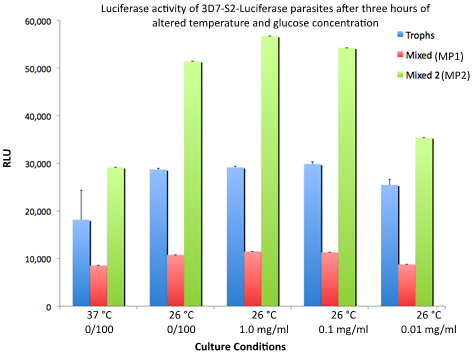
Figure 1: Luciferase assay to measure induction (Relative Light Units, RLU) of the Plasmodium falciparum S2-rRNA-promoter in different environmental conditions.

Main assignment: Short scientific report

In this section you will be presenting the data in table 1 and calculating a t-test to see if there is a significant difference between samples. You will need to make a figure and a table, and discuss the results. You will be presenting this section as a small report. Include a short hypothesis within the introduction, a results section, and a short discussion using the questions below.

A glasshouse experiment was performed to investigate the effect of different levels of carbon dioxide in the atmosphere on the growth of tomato plants (Solanum lycopersicum).

Seedlings of the same age post germination were obtained. Fifteen seedlings were harvested immediately, dried and weighed while the remaining seedlings were grown in one of three levels of carbon dioxide for eight weeks. Fifteen seedlings were placed in each treatment. After eight weeks the plants were harvested and weighed (fresh weight). They were then placed in an oven to dry out and reweighed to obtain the dry weight. The results of the total dry weight measurements are given in the table below.

Table 1: Dry weights of tomato plants grown under different CO2 regimes (g)
Replicates Initial weight seedlings (g) Low CO2

(g) Normal CO2

(g) High CO2

Replicates

Initial weight seedlings (g)

Low CO2

(g)

Normal CO2

(g)

High CO2

(g)

1

0.31

0.51

0.67

2.04

2

0.12

0.41

0.57

1.74

3

0.09

0.05

0.46

1.27

4

0.15

0.32

0.72

1.36

5

0.40

0.15

0.05

1.98

6

0.14

0.11

0.69

2.22

7

0.19

0.13

0.59

1.45

8

0.17

0.11

0.41

1.89

9

0.13

0.21

0.21

1.18

10

0.28

0.14

0.37

1.49

11

0.30

0.19

0.87

2.08

12

0.22

0.21

0.92

1.14

13

0.08

0.05

0.61

1.10

14

0.20

0.12

0.41

1.25

15

0.26

0.04

0.43

0.78

You will have to present this data as a short report. The report should be no longer than 2 pages of 1.5 spaced 12 point justified text (excluding reference list). Three references: your text book plus two additional references from journal articles or books must be used in your report.

Your report must have an Introduction that explains the experiment and a brief hypothesis of what is expected when CO2 conditions change. The report should include answers to the following questions (NOT as question and answer format).

Q1 Calculate the mean and standard deviation for the four sets of replicates. Plot the four means on a graph, including error bars (1 standard deviation). Place this figure in a word document.

Q2 Carry out a t-test to determine if there is a significant difference between each pair of results. Present the t-test results in a table in a word document.

Q3 Describe the results in a few concise sentences in the results section.

Q4 Using your knowledge of photosynthesis and respiration, discuss the results. You will need to use two additional references (not your practical manual) as well as referring to your results to support your discussion.


Attachment:- Data Assignment.xls

Reference no: EM13884200

Questions Cloud

Accounting standards generally accepted by the securities : Jennifer Branson is a new staff auditor on the audit engagement of Greenville Light & Sound, which is a publicly traded company with a calendar year end.
Selective oxidation of propylene : Carolina (H2C=CHCHO) is made by selective oxidation of propylene at 2 bar, 350 °C using a molybdenum, iron, and bismuth catalyst on a silica support
Will surely die while waiting for ems to arrive : You have just recently been certified in CPR. You are caring for a 63 year old woman who is temporarily in the nursing facility for rehabilitation following a hip replacement.
Commercial cost estimating software : Using the data on equipment costs given in this chapter or commercial cost estimating software, estimate the cost of the following equipment:
Calculate the mean and standard deviation for the four sets : Calculate the mean and standard deviation for the four sets of replicates and determine if there is a significant difference between each pair of results.
Information contained in this report : 1.With greater frequency, organizations are issuing corporate social responsibility (CSR) reports that describe how they are engaging in socially responsible activities.
Suitable materials of construction : Suggest suitable materials of construction for the following applications: a. A 10,000 m3 storage tank for toluene
Federal financial assistance have on the audit process : 1.The audit firm of Waggoner and Allen, LLP, recently received a request to submit a proposal to audit the financial statements of the Williamson County Public School System.
Convert the fahrenheit temperature to celsius : convert the Fahrenheit temperature to Celsius

Reviews

Write a Review

Basic Statistics Questions & Answers

  Estimate the p-values using excel function

In Excel, which of the following functions is used to conduct a hypothesis test (using the  p -value) for a population variance

  Describe an alternative to counterbalancing as a means of

describe an alternative to counterbalancing as a means of controlling confounding variables. give an example to back up

  Cost of hospital emergency room visit for medical service

Assume that the cost for this type of hospital emergency room visit is normally distributed with a standard deviation of $92. Assume that the following questions about the cost of a hospital emergency room visit for this medical service.

  What are precision and accuracy?

What are precision and accuracy?

  Assuming a linear relationship use the least-squares method

an accountant for a large department store would like to develop a model to predict the amount of time it takes to

  A car agency sells 50 of its inventory of a certain

a car agency sells 50 of its inventory of a certain foreign car equipped with side airbags. let x be the number of cars

  A bagel shop wants to estimate their daily demand for their

a bagel shop wants to estimate their daily demand for their popular poppy seed bagel. the shop owner determined that

  Sparr investment inc specializes in tax-deferred investment

sparr investment inc. specializes in tax-deferred investment opportunities for its clients. recently sparr offered a

  Sum of random variables

Suppose that the grams of fat have a normal distribution and form 90%, 95%, and 99% confidence intervals for the mean grams of fat. Based on this data, can we say that the labeling on the package is misleading?

  What is the likelihood at least one has a drug problem

How many would you expect to have a drug problem? What is the standard deviation? What is the likelihood that none of the workers sampled has a drug problem? What is the likelihood at least one has a drug problem?

  Consequences of making a type one-two error

In the context of this scenario, what would be the consequences of making a Type I error?

  The laurier companys brand has a market share of 30 suppose

the laurier companys brand has a market share of 30. suppose that 1000 consumers of the product are asked in a survey

Free Assignment Quote

Assured A++ Grade

Get guaranteed satisfaction & time on delivery in every assignment order you paid with us! We ensure premium quality solution document along with free turntin report!

All rights reserved! Copyrights ©2019-2020 ExpertsMind IT Educational Pvt Ltd