Reference no: EM132278810
Epidemiology Assignment Questions -
Q1. In a study of party-going and liver disease, an Odds Ratio of 3.0 was observed, indicating a 'crude' or unadjusted association between party-going and liver disease. Data was also collected on alcohol use (yes/no). When the researchers stratified the party-going-liver disease analysis by alcohol use, they found Odds Ratios of 1.0 for both users and non-users of alcohol.
a. How can these findings be explained? Explain in 2-4 complete sentences, defining any key terms used.
Q2. Researchers conducted a study to investigate whether cigarette smoking causes coronary heart disease. The researchers recruited 2,500 people who smoked cigarettes and 4,500 who did not smoke cigarettes. None of the participants reported having coronary heart disease. Over the next five years participants were contacted annually and asked if they had been diagnosed with coronary heart disease in the past year. The results from the study after five years of follow-up are presented in the following table:
|
Coronary heart disease
|
|
Yes
|
No
|
Total
|
|
Smoke cigarettes
|
Yes
|
84
|
2,416
|
2, 500
|
|
No
|
87
|
4,413
|
4,500
|
|
Total
|
171
|
6,829
|
7,000
|
a. Which of the following measure of association is appropriate to describe the association between smoking and coronary heart disease:
a. Prevalence rate ratio
b. Odds ratio
c. Relative risk (risk ratio)
d. Rate ratio
e. Incidence rate
b. The correct value for this measure of association for this study, as calculated from the table above, is
a. 1.0
b. 0.5
c. 3.6
d. 1.7
e. 0.02
c. Your interpretation of this result is:
a. Those who smoke cigarettes have half the risk of coronary heart disease of those who don't smoke cigarettes.
b. Those who smoke cigarettes have more than three and half times the risk of coronary heart disease of those who don't smoke cigarettes.
c. Those who smoke cigarettes have more than one and half times the risk of coronary heart disease of those who don't smoke cigarettes.
d. There is no association between smoke cigarettes and coronary heart disease.
e. None of the above.
Q3. Five thousand overweight Australians aged 50 years were given a health check and 400 were found to have diabetes. Ten years later (at age 60) all 5,000 attended a second health check and another 750 had developed diabetes. The 400 people initially identified with diabetes have received ongoing treatment for their diabetes.
a. What was the prevalence of diabetes in the sample at age 50? Give the answer as a percentage.
b. What was the prevalence of diabetes in the sample at age 60? Give the answer as a percentage.
c. How many people were at risk of developing diabetes at the start of the 10 year period?
d. What was the incidence of diabetes in these people?
e. Is this a measure of cumulative incidence or incidence rate? Why?
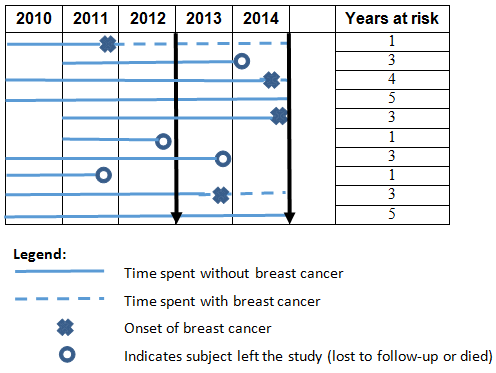
Q4. Figure 1 below represents a study of ten women in their 60's with a strong history of familial breast cancer. All were initially healthy when they joined the study during the period 2010 to 2014 and were followed up for the remainder of the period to observe the onset of breast cancer.
Calculate the following quantities:
a. The incidence rate (to one decimal place).
b. The cumulative incidence (as an average per year) (to two decimal places).
c. The point prevalence at the end of 2012 (to three decimal places) (to three decimal places).
d. The point prevalence at the end of 2014 (to three decimal places) (to three decimal places).
Figure 1. Ten initially healthy women followed up between 2010 and 2014 to observe the onset of breast cancer
Note: the three downward arrows mark the mid points of three years

Note: The years at risk for this diagram only counts whole years, use those for your calculations.
Q5. 'Job strain' is a workplace exposure defined as a situation in which a worker experiences high job demands and low job control concurrently. Exposure to job strain is prospectively associated with depression, with an Odds Ratio of 1.74 (95% Confidence Interval of 1.53-1.96) after adjustment for known confounders (Theorell et al, BMC Public Health 2015 15:738). The prevalence of exposure to job strain differs substantially by sex-18.6% among working Victorian males, and 25.5% among working Victorian females (LaMontagne et al, BMC Public Health 2008, 8:181. However, there was no effect modification by sex: so the magnitude of the job strain-depression relationship was the same for males and females (OR = 1.74) (Theorell et al, BMC Public Health 2015 15:738).
a. What is the population attributable fraction of job strain-associated depression in working Victorian men? You may assume for the purposes of your calculations that the OR approximates the risk ratio (RR). What does this mean in words that a policy-maker or member of the public could understand (i.e., without using the words 'population attributable fraction')?
b. What is the population attributable fraction of job strain-associated depression in working Victorian women? What does this mean in words that a policy-maker or member of the public could understand (without using the words 'population attributable fraction')?
Note - Need Questions 4 and 5 only. It is contemporary health.