Calculate the expected number of sequencing errors

Assignment Help Applied Statistics
Reference no: EM132367806

Assignment -

Use R for calculation and graphical illustration of answers using R is encouraged

1. The sequencing error in a genome sequencing project is on average 1 wrong base pair in 100,000. A genome has length 50,000,000 base pairs.

(a) Explain what a Poisson distribution is.

(b) i. Using a Poisson distribution, calculate the expected number of sequencing errors in the genome.

ii. If the genome were sequenced multiple times how would the number of errors fluctuate around this expected value?

(c) Draw a plot of the probability density function (pdf) for the number of sequencing errors on the genome. Label the graph with your answers from (b). Indicate on the same graph how the distribution will change if the expected number of errors is doubled.

(d) Can you name another distribution that can be a good approximation of the Poisson distribution in (b)? What are the mean and standard deviation of this distribution?

2. (a) Illustrate the following terms on a plot: null hypothesis, acceptance region, rejection region , critical value, p-value. Provide a short description of each of these terms.

(b) How will changing the number of independent data points in any sample affect the estimate of the mean value of the distribution from which the sample is drawn? What is the standard deviation of the distribution of the means? Draw a plot of the mean values vs. sample size to illustrate this effect (e.g., with a mean value around 10).

(c) Draw the probability density for a normally distributed experimental variable with mean 10 and standard deviation 5. On the same graph, plot the probability density for the mean of 9 sample points taken from N(10, 5). Indicate a p-value for a sample of this size to have a mean above 13.

3. A series of small tissue samples are taken from different regions of the front legs of frogs at a late stage of limb development. The researchers are interested to investigate the possible role of protein X in the limb development process. The levels of protein X (in nanograms/gram) are measured for 12 tissue samples from each region and the results are plotted below.

1187_figure.png

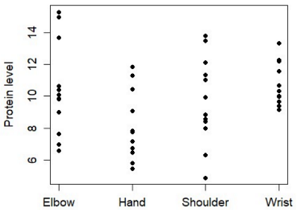
a) Describe in detail how to test the hypothesis that the level of the protein differs in different regions of the frog's front leg.

b) Assuming that a difference is found, how could you then test for which regions differ in their protein level.

c) State the assumptions inherent in your testing procedures in parts a) and b).

d) Many developmental processes depend on chemical concentration gradients. Briefly outline how the data above could be used in a statistical test to assess the evidence for a gradient in the level of protein X from shoulder to wrist.

4. Two groups (A and B) of randomly selected patients with Lickspittle syndrome are treated with different experimental drugs for a year and at the end of that time the members of each group are assessed by a clinical psychologist for improvement of their symptoms. The 40 patients in Group A are given Drug X and 20 are found to improve. The patients in group B are given drug Y. Of the 60 patients in group B, 20 do not improve. A scientist wishes to investigate if there is any significant difference in the frequency of improvement under each drug regime.

a) Organize the data into a contingency table and formulate a null hypothesis to test for difference in improvement.

b) How is the χ2 distribution defined?

c) Test your null hypothesis using a χ2 distribution. Show the details of your working.

Reference no: EM132367806

Questions Cloud

Project execution-control and closure proposal : Examine how you manage your project performance via Earned Value Management (EVM). Identify at least three key EVM metrics you will use for your project.
Learned about effective leadership : This competency will allow you to demonstrate what you have learned about effective leadership by creating a plan to successfully run a small business.
Explaining the overall plan for communication management : Identify and explain your overall plan for communication management during the project. The plan must be comprehensive and at a minimum address.
Articles on hypothesis test and its application in business : Use the Internet or Strayer Library to research articles on hypothesis test and its application in business.
Calculate the expected number of sequencing errors : Using a Poisson distribution, calculate the expected number of sequencing errors in the genome. Explain what a Poisson distribution is
PM Code of Ethics and Professional Development Analysis : PM Code of Ethics and Professional Development Analysis- As professional project managers in today's ever-changing and chaotic environment.
Develop a vision and mission statement for the project team : Develop a vision and mission statement for the project team specific to the current project. HINT: It is highly recommended to follow the guidance offered.
How might a person acquire the given abilities : "Success as an expatriate employee" - What abilities make a candidate more likely to succeed in an assignment as an expatriate? Which of these abilities.
Explain the importance of hrm to any organization : In your own words, explain the importance of HRM to any organization then determine a HRM function that interest you as a future career.

Reviews

Write a Review

Applied Statistics Questions & Answers

  Hypothesis testing

What assumptions about the number of pedestrians passing the location in an hour are necessary for your hypothesis test to be valid?

  Calculate the maximum reduction in the standard deviation

Calculate the maximum reduction in the standard deviation

  Calculate the expected value, variance, and standard deviati

Calculate the expected value, variance, and standard deviation of the total income

  Determine the impact of social media use on student learning

Research paper examines determine the impact of social media use on student learning.

  Unemployment survey

Find a statistics study on Unemployment and explain the five-step process of the study.

  Statistical studies

Locate the original poll, summarize the poling procedure (background on how information was gathered), the sample surveyed.

  Evaluate the expected value of the total number of sales

Evaluate the expected value of the total number of sales

  Statistic project

Identify sample, population, sampling frame (if applicable), and response rate (if applicable). Describe sampling technique (if applicable) or experimental design

  Simple data analysis and comparison

Write a report on simple data analysis and comparison.

  Analyze the processed data in statistical survey

Analyze the processed data in Statistical survey.

  What is the probability

Find the probability of given case.

  Frequency distribution

Accepting Manipulation or Manipulating

Free Assignment Quote

Assured A++ Grade

Get guaranteed satisfaction & time on delivery in every assignment order you paid with us! We ensure premium quality solution document along with free turntin report!

All rights reserved! Copyrights ©2019-2020 ExpertsMind IT Educational Pvt Ltd