Calculate the deviations for the MapQuest estimates

Assignment Help Applied Statistics
Reference no: EM131890126

Midterm Exam - Untimed Component

Answers to discussion questions should be brief and concise.

The manager of a distribution center is concerned about delivery times associated with transporting materials to customers. In particular, deviations from the estimated travel time are of interest. Late arrivals cause financial penalties whereas early arrivals cause customer dissatisfaction due to congestion in the shipping areas and lost opportunity for the distribution center. A random sample of 100 recent deliveries is taken. The deviation in actual delivery time and estimated delivery time is calculated as Deviations = actual time - estimated time.

1. A graphical summary is provided below. Give a brief description of the results.

42_figure.png

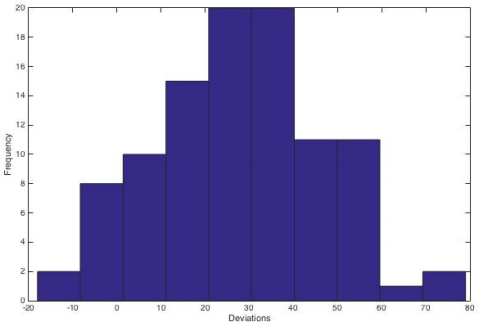
2. If a calculated deviation (D) is positive, was the delivery late or early?

3. Each day hundreds of deliveries are scheduled. The manager decides to monitor the time deviations by taking a random sample of 16 deliveries and calculating the average deviation defined by D- = 1/16 i=116 Di for each day. Assume that historical data such as that displayed in part (1) suggests that the distribution of deviations Di have a mean of 27 minutes and a standard deviation of 20 minutes. Find the probability that the sample mean is less than 15 minutes. (i.e. Find P[D- < 15] for a sample of size n=16).

4. A supervisor suggests that the old computer program for estimating delivery times (used in problems 1-3) be abandoned. Instead, schedulers could use an alternative such as MapQuest to estimate driving times. As a pilot study, 500 recent deliveries were randomly selected. The Excel file named Midterm 2018 Data.xls contains the following variables:

Actual Times: actual time required to make delivery

Old Model Deviations: difference in actual delivery time and predicted delivery time using old computer prediction model

MapQuest: predicted delivery times for the randomly selected routes using MapQuest

Use the data to calculate the deviations for the MapQuest estimates

(DMapQuest = actual delivery time - MapQuest predicted delivery time), then construct an appropriate graph for comparing the deviations for the Old Computer model and the MapQuest model. Interpret the results and indicate which prediction model should be used in the future. (Do NOT include the calculated deviations here. Do include the graph and interpretation.)

5. A driver reads your answer to part (4) and makes the following comment:

MapQuest gives driving times for cars. Driving times for trucks will probably be longer because we can't go as fast, especially in city traffic. Is there some way to adjust the MapQuest prediction to make it fit trucks better?

Construct a fitted line plot (scatterplot with fitted linear regression line) using the MapQuest times as the predictor variable and the actual times as the response variable. Call the fitted values 'Adjusted MapQuest' times. Provide the fitted line plot, regression equation and R2 values associated with the 'Adjusted MapQuest' times. Interpret your results and indicate whether the driver's suggestion is valid or invalid.

6. Use the regression equation given in part (5) to provide 'Adjusted MapQuest' times for the sample of 500 deliveries and calculate the Adjusted Deviations = Actual times - Adjusted MapQuest times. (You do NOT need to put those values here.) Construct an appropriate graph for comparing the deviations associated with the Old Computer Model, the MapQuest model and Adjusted MapQuest model and include it here. Interpret the graph and recommend the modeling tool (method of predicting delivery times) you feel is most accurate.

Attachment:- Data File.rar

Reference no: EM131890126

Questions Cloud

Determine the mean and standard deviation of x : Determine the mean and standard deviation of x. (Round the answer to two decimal places.)
What is the probability that a randomly selected resident : a) What is the probability that a randomly selected resident has neither pet? b) What is the probability that a randomly selected resident has a cat
How does the organization promote the use of technology : Choose an organization and discuss how it is using technology to lead employees. What forms of technology is this organization using to inform employees?
When designing a new thrill ride for an amusement park : When designing a new thrill ride for an amusement park, the designer must consider the sitting heights of males.
Calculate the deviations for the MapQuest estimates : ST 560 Midterm Exam - Untimed Component. Use the data to calculate the deviations for the MapQuest estimates then construct an appropriate graph
Sufficient evidence to warrant rejection : There is sufficient evidence to warrant rejection of the claim that the mean difference of post-test from pre-test is less than 0.
Determine the capital recovery cost of printer : Determine the capital recovery cost of printer. What is the variable cost per year? d) What is the EUAC of the printer?
Explain how a logit model can be estimated : Explain the difference between marginal effects at the averages and average marginal effects in the context of a probit model
How many standard deviations from the mean is john doe : How many standard deviations from the mean is John Doe, who is 65 inches tall?

Reviews

len1890126

3/7/2018 12:31:25 AM

Instructions: Show solutions in a neat and orderly manner. Answers to discussion questions should be brief and concise. If you need clarifications, please email your questions to the instructor. Do NOT post your questions on the Blackboard Learn Discussion Board. Using any resources other than the instructor, textbook, class notes, Excel or Minitab will be considered an act of academic misconduct. Submit your solutions via the Assignment labeled Midterm Exam. A full submission includes: one Word (or similar format) document.

Write a Review

Applied Statistics Questions & Answers

  Hypothesis testing

What assumptions about the number of pedestrians passing the location in an hour are necessary for your hypothesis test to be valid?

  Calculate the maximum reduction in the standard deviation

Calculate the maximum reduction in the standard deviation

  Calculate the expected value, variance, and standard deviati

Calculate the expected value, variance, and standard deviation of the total income

  Determine the impact of social media use on student learning

Research paper examines determine the impact of social media use on student learning.

  Unemployment survey

Find a statistics study on Unemployment and explain the five-step process of the study.

  Statistical studies

Locate the original poll, summarize the poling procedure (background on how information was gathered), the sample surveyed.

  Evaluate the expected value of the total number of sales

Evaluate the expected value of the total number of sales

  Statistic project

Identify sample, population, sampling frame (if applicable), and response rate (if applicable). Describe sampling technique (if applicable) or experimental design

  Simple data analysis and comparison

Write a report on simple data analysis and comparison.

  Analyze the processed data in statistical survey

Analyze the processed data in Statistical survey.

  What is the probability

Find the probability of given case.

  Frequency distribution

Accepting Manipulation or Manipulating

Free Assignment Quote

Assured A++ Grade

Get guaranteed satisfaction & time on delivery in every assignment order you paid with us! We ensure premium quality solution document along with free turntin report!

All rights reserved! Copyrights ©2019-2020 ExpertsMind IT Educational Pvt Ltd