Reference no: EM132614378
Question 1. (a) (i) What is a Variable?
(ii) List and briefly explain the two types of Variables.
(iii) List and briefly explain the various types of the two main categories of Variables with specific examples under each type.
(b) For a given set of data ∑ x = 59 , ∑ y = 45 , ∑ x2 = 417 , ∑ y2 = 241, ∑ xy = 313 and n = 10 . Find the Pearson's coefficient of correlation. Comment on your results.
Question 2. In a certain hospital, the mean weight of group of babies born on the same day was observed over several months at intervals of one month. The results over the first seven months are shown in the table below.
|
Age in months (A)
|
0
|
1
|
2
|
3
|
4
|
5
|
6
|
7
|
|
Mean weight in kg (W)
|
2.5
|
3.75
|
4.2
|
5.7
|
6.4
|
7.35
|
8.25
|
9.6
|
(a) Draw a scatter diagram of the mean weight (W ) against the age A.
(b) Draw the line of best fit of W on A and estimate the coefficient of regression.
(c) From your graph, estimate the mean weight of a person whose age is 6.3 months.
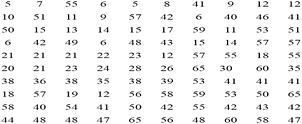
Question 3. In the Kintampo north district where you have been stationed as your permanent post after your successful completion of your degree in nursing at Catholic university college of Ghana- Sunyani, the district health directorate received a report on the occurrence of suspected yellow fever disease in many parts of the district. The table below shows the ages of 100 reported cases of the disease. As a health professional, the district director of health services has asked you to analyze the data so that the DHA would be able to identify and prioritize the age group to target for a health intervention;

a. Construct a grouped frequency distribution table.
b. Calculate the following;
i. Mean age
ii. Median age
iii. Modal age
Question 4. Upon arrival at a hospital's emergency room, patients are categorized according to their condition as critical, serious or stable in the past year.
10% of the emergency room patients were critical. 30% of the emergency room patients were serious. The rest of the emergency room patients were stable. 40% of the critical patients died.
10% of the serious patients died. 1% of the stable patients died.
Given that a patient survived, what is the probability that the patient was categorized as serious upon arrival?
Question 5. (a) Let X = number of obese subjects out of n = 3 randomly chosen US adults where p = 0.209 . Calculate P ( X = 2) given that X follows a binomial distribution.
(b) Suppose that 55% of CUCG undergraduates are women. In a random sample of 7 CUCG undergraduates, what's the probability that 3 out of them are women?
(c) The annual number of accidents that occur at a certain road junction is modelled using Poisson distribution with mean 5 . Calculate the probability of exactly 3 accidents at the road junction in the next year?
Question 6. Distribution of subjects selected according to gender in a Study.
|
Observed Value
|
|
|
Biology
|
Physics
|
Chemistry
|
Total
|
|
Male
|
12
|
16
|
21
|
49
|
|
Female
|
20
|
11
|
20
|
51
|
|
Total
|
32
|
27
|
41
|
100
|
|
Expected Value
|
|
|
Biology
|
Physics
|
Chemistry
|
Total
|
|
Male
|
?
|
?
|
?
|
?
|
|
Female
|
?
|
?
|
?
|
?
|
|
Total
|
?
|
?
|
?
|
?
|
(a) Calculate expected value for each cell and complete the table
(b) Construct the null hypothesis
(c) Calculate the degree of freedom
(d) Given that the Chi Square value at 0.05 level of significance with a degree of freedom equals 2 is 5.991.Find the Chi square test value and interpret the results.