Reference no: EM13504457
1. Do you think requiring employer-based insurance plans to cover contraception will increase unemployment among women? Discuss in light of the results in the Gruber paper on mandated maternity benefits.
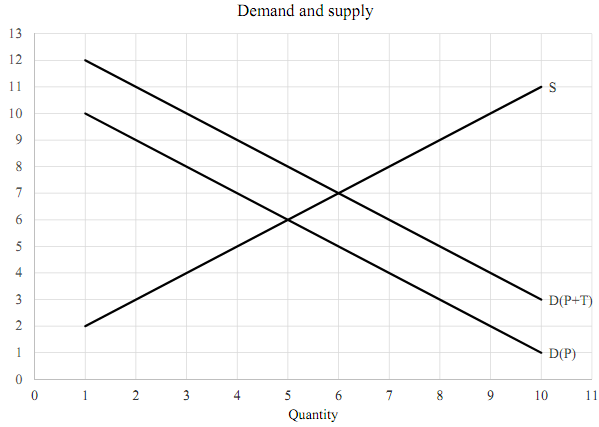
2. See the figure. It depicts demand and supply when there is a tax of $2 on every unit of a good that is sold. The top demand curve depicts consumers' demand for the good as a function of its total cost, including the price plus the tax. Explain why $7 is not the equilibrium price. (Remember, when there is a tax, the cost to consumers is greater than the price.)

3. Assume the distribution of annual US stock returns follows a normal distribution with a mean of 9 (corresponding to a 9% increase per year) and a standard deviation of 16. Suppose you invest $7,500 in stocks with the goal of saving enough to buy a $10,000 car in 3 years. What is the probability you will have enough money at the end of 3 years to buy the car? If you type (or copy) "=NORM.INV(RAND(), 9, 16)" in a cell in Excel the result will be a random draw from a normal distribution with mean 9 and standard deviation 16.
4. If the value of a price index is 125 in 2005 and 180 today, what is the value of $200 in 2005 dollars today?
5. Suppose you want to measure the cost of a complex surgery that is only performed at a few hospitals and the cost of routine child delivery, a service offered at almost all hospitals. In which case do you think the reimbursment rate (i.e., the price) is going to be closer to hospitals' true cost of producing the service? Why?
6. What is the rationale for discounting when you calculate the cost and benefits of government programs?