Calculate the consumer and producer surplus

Assignment Help Macroeconomics
Reference no: EM132308149 , Length: word count:2000

Economics Assignment -

Learning Outcomes -

  • Identify and explain the key ideas that define economic way of thinking and the maximisation of scarce resources.
  • Analyse how prices are determined in a market.
  • Compare and contrast the key characteristics of various market structures and market strategies adopted by firms in different market environments.

Assessment Task Description - Answer all 8 questions.

Question 1: What will happen to the equilibrium price and quantity of margarine in each of the following cases? Illustrate with a diagram and explain whether demand or supply (or both) have shifted and in which direction. (In each case, assume ceteris paribus. Students are allowed to make appropriate assumptions on the relationship between the goods).

(a) A fall in the price of margarine;

(b) A fall in the demand for yoghurt;

(c) A fall in the price of bread;

(d) A rise in the supply for bread;

(e) An expected fall in the price of butter in the near future;

(f) A tax on butter production;

Question 2: a) When the price of Orange increases from $3/kg to $3.5/kg the quantity sold decreases from 240kg per day to 200kg per day. Calculate the price elasticity coefficient for Orange.

b) Describe the relationship between the price and the total revenue for elastic, inelastic and unit elastic demand respectively. Use diagrams to illustrate the relations you have described.

c) Opponents of increasing of the tax on sellers of cigarettes argue that the big tobacco companies just pass the tax along to the consumers. Do you agree or disagree? Use suitable diagrams explain your answer.

Question 3: (a) Explain and illustrate using suitable diagram, the impact of external costs using the example of carbon emission in coal fired electricity production, and explain what policy measures can be used to deal with the external effect in order to obtain socially efficient allocation of resource.

(b) Explain and illustrate using suitable diagram, the impact of external benefits on resource allocation using the example high education, and explain what policy measures can be used to deal with external effects in order to obtain socially efficient allocation of resource.

(c) List two public goods or service and two private good and service and explain why these goods or service become public goods or service.

Question 4: Consider the demand function and supply function of widgets to be:

Qd = 100 - P (1)

Qs = 4P (2)

a) What is the market equilibrium based on the equation (1) and equation (2)?

b) Calculate the consumer and producer surplus at the market equilibrium. What is the total surplus?

c) Using equation (1) and equation (2), sketch the demand and supply diagram and indicate your results from parts a) and b). Correctly label the diagram.

Question 5: You run a painting company with a total fixed cost of $200 and the following schedule for total cost:

Output

Fixed Cost

Variable Cost

Total Cost

Average Fixed Cost - AFC

Average Variable Cost - AVC

Average Total Cost - ATC

Marginal Cost - MC

0


20


1


22


2


28


3


38


4


52


5


70


6


92


a) Complete the table by calculating total variable cost (TVC); average fixed cost (AFC), average variable cost (AVC); average total cost (ATC); and marginal cost (MC) for each quantity.

b) Draw graph of costs (all in the same graph) for AFC, AVC, ATC and MC.

c) Describe the shapes of the AFC, ATC, AVC and MC, and explain what leads to the shapes.

d) Describe the relations between the MC and the ATC and AVC, and explain the reasons leading to the relations.

e) Do we have the law of diminishing returns in this example?

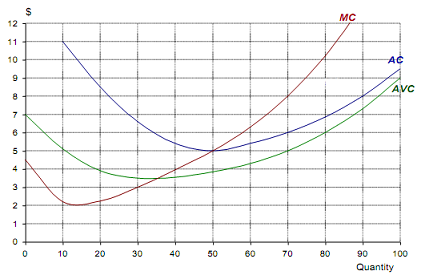
Question 6: The following diagram shows the cost curves of a firm under perfect competition.
447_figure.png

(a) How much will the firm produce in order to maximise profits at a price of $8 per unit?

(b) What will be its average cost of production at this output?

(c) How much (supernormal) profit will it make?

(d) How much will the firm produce in order to maximise profits at a price of $5 per unit?

(e) How much (supernormal) profit will it make?

(f) How much will the firm produce in order to maximise profits at a price of $4 per unit?

(g) What will be its profit position now?

(h) Below what price would the firm shut down in the short run?

(i) Below what price would the firm shut down in the long run?

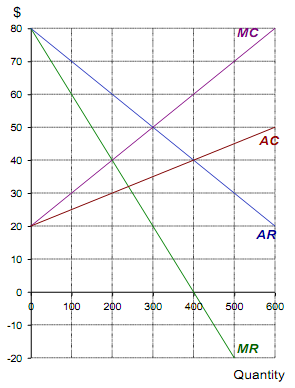
Question 7: A monopolist is faced with the following cost and revenue curves
2411_figure1.png

(a) What is the maximum-profit output?

(b) What is the maximum-profit price?

(c) What is the total revenue at this price and output?

(d) What is the total cost at this price and output?

(e) What is the level of profit at this price and output?

(f) If the monopolist were ordered to produce 300 units, what would be the market price?

(g) How much profit would now be made?

(h) If the monopolist were faced with the same demand, but average costs were constant at $60 per unit, what output would maximise profit?

(i) What would be the price now?

(j) How much profit would now be made?

Question 8: (a) Illustrate with diagrams and explain how a perfectly competitive firm and monopolist differ in their allocative efficiencies;

(b) Illustrate with a diagram and explain the long-run perfectly competitive equilibrium for the firm.

Reference no: EM132308149

Questions Cloud

Develop more effective working relationships with them : What advice would you give David to help develop more effective working relationships with them?
Case achieve by analyzing and using big data : What business benefits did the organizations described in this case achieve by analyzing and using big data?
What are the negative impacts of CKEs business intelligence : What are the negative impacts of CKE’s business intelligence? How can CKE use tactical, operational, and strategic BI?
How individual needs influence motivation : Essential managerial skills and how we learn them. How individual needs influence motivation
Calculate the consumer and producer surplus : MA503/GA503 Economics Assignment, Melbourne Institute of Technology, Australia. Calculate the consumer and producer surplus
Critical evaluation of the old accounting standard for lease : HI6025 Accounting Theory and Current Issues Assignment - Accounting for Lease: A Critical Review, Holmes Institute, Australia
Predictive analysis in facility services : The topic is use of predictive analysis in facility services (Cleaning company) - make report of 1500 words on this in IEEE format full report
Write summary of main thesis and its supporting arguments : Read the article. Write a 3 page summary of the main thesis and its supporting arguments. Article - Climate Change and Shared Ecological Responsibility
Analyze the networking needs of business : Describe and explain the role and function of network connectivity in current computing - Describe and explain the protocols and interactions that implement

Reviews

len2308149

5/17/2019 5:49:55 AM

I want changes in the same file which i have sent you all the highlighted once. I was asked to add graphical explanation for question 1 all sub questions from a-f and all graphs quality needs to be changed professor asked me to use word, excel or PowerPoint either of this for graphs not from paint and the explanation to graphs should be clearly mentioned in the graphs like labeling of lines also bar graph should be replaced. Demand and supply curve type of graphs are supposed to be used for question 3 and whichever question it is required, question for part c fixed cost values is 20 instead of 200 slight changes in question, changes required in calculation. Mainly I was asked to do concentrate of graphs for nice presentation, explanation and labelling and rest as per the Feed Back Report. Need it in HD quality.

len2308149

5/17/2019 5:49:49 AM

Word limit - 2000 words. Submission Guidelines - All work must be submitted on Moodle by the due date along with a completed Assignment Cover Page. The assignment must be in MS Word format, 1.5 spacing, 11-pt Calibri (Body) font and 2 cm margins on all four sides of your page with appropriate section headings. Reference sources must be cited in the text of the report, and listed appropriately at the end in a reference list using APA 6th edition for the School of Business.

Write a Review

Macroeconomics Questions & Answers

  Inflation targeting be a good policy

Why might it be difficult for the Fed to formally adopt inflation targeting?  Would inflation targeting be a good policy for the Fed in the present economic environment

  In using the taylor rule

In using the Taylor Rule as a guideline for monetary policy, what are the pros and cons of using forecasted values of inflation and output rather than observed values of these variables?

  Describe the present economic crisis situation in europe

Describe the present economic crisis situation in Europe.  Why has it been so difficult for the Europeans to find a solution to this problem?   Comment on what implications the crisis may have for the rest of the world if Europeans are not able to ag..

  Long-term federal government budget problems

Question:. Explain why there are long-term Federal government budget problems. Explain why the base-line forecast of the CBO is misleading.

  Derive and compare demand curve

Question based on Derive and compare demand curve,  Derive Ambrose's demand function for peanuts. How does it compare with Johnny's demand curve for peanuts?

  Problem based on utility function

Problem based on  Utility Function - Problem,  Answer and explain the following using a diagram which is completely labeled.

  Laffer curve : tax rate and tax revenue

Question based on Laffer Curve : Tax Rate and Tax Revenue,  Do raising tax rates necessarily raise tax revenue? What factors affect how tax revenue changes when tax rates change?

  Problem - income elasticity of demand

Problem - Income Elasticity of Demand,  Interpret the following Income Elasticities of Demand (YED) values for the following and state if the good is normal or inferior; YED= +0.5 and YED= -2.5

  Positive balance of payment

Question Positive Balance of Payment: "Things will look good for the US if we could just get to where we are consistently running a positive Balance of Payments."

  Effect of recession on the investment curve

Comment on the effect of a recession on the investment curve (only) and on the level of savings, investment, and the equilibrium real interest rate in the financial crisis that hits United States first starting in fall 2007.

  Affect of falling domestic investment on trade surplus and

How will a fall in domestic investment affect the trade surplus and net capital outflows in the domestic economy, the trade deficit and capital inflows in the rest of the world.

  Crises in the banking sector and bank run

Banking crises crisis decreases depositors' confidence in the banking system. What would be the effect of a rumor about a banking crisis on checkable deposits in such a country?

Free Assignment Quote

Assured A++ Grade

Get guaranteed satisfaction & time on delivery in every assignment order you paid with us! We ensure premium quality solution document along with free turntin report!

All rights reserved! Copyrights ©2019-2020 ExpertsMind IT Educational Pvt Ltd