Reference no: EM132248421
Assignment
Classify Letters
Load test and training data ocr10-train.txt and ocr10-test.txt. Each row in the dataset consists of 128 binary values corresponding to pixels of an image of a hand written letter. The last column in each row is the class of the letter (0 - 9 => ‘a' - ‘j').
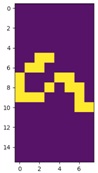
Confirm that the data is being read correctly by reshaping the first row of data to a 16 x 8 array and displaying it.
Use all the training data to train a multinomial Naïve Bayes model (use MultinomialNB), with a smoothing factor of 1 and a prior distribution obtained from the training data. Calculate the confusion matrix and display.
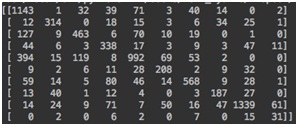
Reformat the confusion matrix to better present it (use matplotlib).
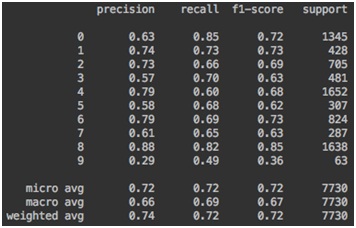
Display the precision, recall and f1-score.
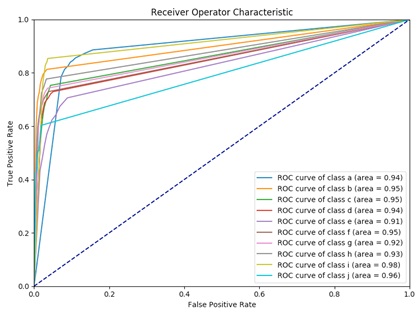
Produce the Receiver Operator Characteristic (ROC) plot for each class (binary classification) at probability thresholds from 0 - 1 at steps of 0.1. For each curve, calculate the Area Under the Curve (AUC).
Identify the worst performing class based on the ROC. Which class causes the most confusion with the worst performing class?
Attachment:- Machine Learning Applications.zip