Reference no: EM132264476
Assignment - All figures produced will be assessed for appropriateness and quality of the data visualization.
Question 1 - Professional athletes are now commonly tested for steroid use following competition. It is known that there is some risk of sampling error, but this risk is believed to be minimal. What would constitute a Type II error on the part of the testing agency, if their null hypothesis is that the athlete is drug-free?
A. an athlete who is not using steroids tests positive (not drug-free).
B. an athlete who is not using steroids tests negative (drug-free).
C. an athlete who is using steroids tests positive (not drug-free).
D. an athlete who is using steroids tests negative (drug-free).
Question 2 - A researcher is very worried about making a Type I error. What is the alpha level she should choose to minimize the risk of a Type I error?
A. ?? = 0.01
B. ?? = 0.05
C. ?? = 0.025
D. ?? does not have a direct effect on Type I errors
Question 3 - Answer Question using R. IN ADDITION: draw a plot that effectively represents the data in the table.
In animals without paternal care, the number of offspring sired by a male increases as the number of females he mates with increases. This fact has driven the evolution of multiple matings in the males of many species. It is less obvious why females mate multiple times, because it would seem that the number of offspring that a female has would be limited by her resources and not by the number of her mates, as long as she has at least one mate. To look for advantages of multiple mating, a study of the Gunnison's prairie dog followed females to find out how many times they mated (Hoogland 1998). They then followed the same females to discover whether they gave birth later. The results are compiled in the following table:
|
Number of times female mated:
|
1
|
2
|
3
|
4
|
5
|
|
Number who gave birth:
|
81
|
85
|
61
|
17
|
5
|
|
Number who didn't give birth:
|
6
|
8
|
0
|
0
|
0
|
Did the number of times that a female mated after her probability of giving birth?
a. Calculate expected frequencies for a contingency test.
b. Examine the expected frequencies. Do they meet the assumptions of the χ2 contingency test? If not, what steps could you take to meet the assumptions and make a test?
c. An appropriate test shows that the number of mates of the female prairie dogs is associated with giving birth. Does this mean that mating with more males increases the probability of giving birth? Can you think of an alternative explanation?
Question 4 - Use R to make any necessary calculations.
The amount of money spent on health care per person varies enormously among countries (The World Bank 2013). In 2010, this expense ranged from 11.9 U.S. dollars per person (in Eritrea) to $8361 (in the United States). The distribution of this per capita health care expenditure is very skewed, with a long tail corresponding to countries that spend a lot on health care per capita (see the top histogram in the accompanying graph). However, if we look at the log (base 10) of each country's per capita health expenditure, it has a distribution that can be approximated by a normal distribution (see bottom histogram). On the log scale, the mean of the log expenditure is 2.47, with standard deviation equal to 0.72.
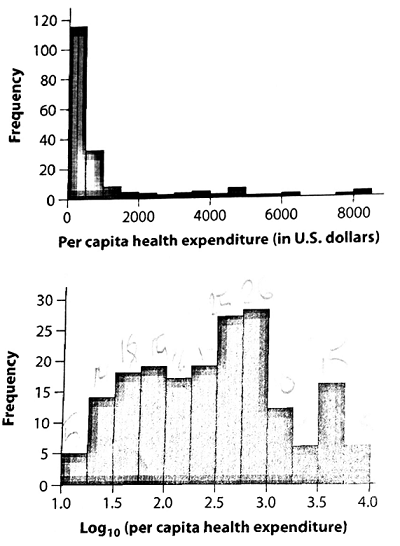
a. Assuming that log health expenditure is normal, calculate the proportion of countries that spend less than $100 per capita on health care. (This corresponds to a log expenditure of 2.)
b. Assuming that log health expenditure is normally distributed, calculate the proportion of countries that spend more than $1000 per capita on health care. (This corresponds to a log expenditure equal to 3.)
c. The true proportions of countries with per capita health expenditure less than $100 or more than $1000 are 0.30 and 0.21, respectively. Comment on why your answers from part (a) and (b) above do not exactly matches these values.
Question 5 - Use R to make any necessary calculations.
The table lists the means and standard deviation of several different normal distributions. For each distribution, calculate the probability of drawing a single Y value greater than the given threshold and the probability of drawing a value less than that threshold.
|
Mean
|
Standard deviation
|
Threshold
|
Pr[Y > threshold]
|
Pr[Y < threshold]
|
|
14
|
5
|
9
|
|
|
|
15
|
3
|
18.5
|
|
|
|
-23
|
4
|
-16
|
|
|
|
14,000
|
5000
|
9000
|
|
|
Question 6 - Two different researchers measured the weight of two separate samples of ruby-throated hummingbirds from the same population. Each calculated a 95% confidence interval for the mean weight of these birds. Researcher 1 found the 95% confidence interval to be 3.12 g < μ < 3.48 g, while Researcher 2 found the 95% confidence interval to be 3.05 g < μ < 3.62 g.
a. Why would the two researchers get different answers?
b. Which researcher most likely had the larger sample?
c. Can you be certain about your answer in part (b)? Why or why not?
Question 7 - Use R to make any necessary calculations.
Researchers studying the number of electric fish species living in various parts of the Amazon basin were interested in whether the presence of tributaries affected the local number of electric fish species in the main rivers (Fernandes et al. 2004). They counted the number of electric fish species above and below the entrance point of a major tributary at 12 different river locations. Here's what they found:
|
Tributary
|
Upstream number of species
|
Downstream number of species
|
|
Ica
|
14
|
19
|
|
Jutai
|
11
|
18
|
|
Japura
|
8
|
8
|
|
Coari
|
5
|
7
|
|
Purus
|
10
|
16
|
|
Manacapuru
|
5
|
6
|
|
Negro
|
23
|
24
|
|
Madeira
|
29
|
30
|
|
Trombetas
|
19
|
16
|
|
Tapajos
|
16
|
20
|
|
Xingu
|
25
|
21
|
|
Tocantins
|
10
|
12
|
a. What is the mean difference in the number of species between areas upstream and downstream of a tributary? What is the 95% confidence interval of this mean difference?
b. Test the hypothesis that the tributaries have no effect on the number of species of electric fish.
c. State the assumptions that you had to mate to complete parts (a) and (b).
Question 8 - In a corporation, the mean entry level salary is $27,000 (POPULATION MEAN) and the standard deviation is $6,000 (POPULATION STANDARD DEVIATION). The entry level salaries for a random sample of 15 employees with only high school degrees is $24,100 The company hypothesizes that employees with only high school degrees have lower entry level salaries on average. What is the probability (as a decimal to three significant digits) that this randomly selected sample of individuals with only a high school degree has a mean entry level salary that is the same as the company average? Use R to show any work.
Question 9 - When using analysis of variance, what are the main advantages of the followings factors?
A. Large sample size
B. Balanced design
Question 10 - Answer the Question AND CONDUCT THE APPROPRIATE TEST. Use R to make any necessary calculations.
Mosquitoes contribute to more human deaths than any other organism, because they transmit diseases such as malaria, dengue fever, and yellow fever. Some of these diseases develop or grow inside the mosquito - a process that can take some time. Therefore, one possible strategy to reduce transmission of disease is to cause mosquitos to die slightly sooner, leaving insufficient time for the disease to develop. Fang et al. (2011) tested the idea by infecting mosquitos with a fungus (Metarhizum anisopliae) that reduces the life span of the insect. In addition, they developed a transgenic strain of fungus that carries a gene for scorpine, a protein from scorpion venom known to inhibit the gamete stages of malaria. They compared three groups of mosquitoes: a "control" group that was not treated with fungus, a "wild type" group that was infected with unmodified fungus, and a "scorpine" group that was infected with the transgenic fungus. Each mosquito was infected with malaria. The response variable was the log number of sporozoites (infectious cells of malaria) in the salivary glands of the mosquitoes. Here are the data:
Control: 7.2, 7.4, 7.4, 7.7. 7.9, 7.9, 8.0, 8.2, 8.3, 8.4, 8.4, 8.5, 9.1, 9.2, 9.2
Wild type: 5.6, 6.5, 6.7. 7.0, 7.5, 7.9, 7.9, 8.0, 8.0, 8.2, 8.4, 9.0, 9.1, 9.0, 9.1
Scorpine: 0.0, 4.4, 5.3, 5.6, 4.1, 5.3, 5.9, 6.0, 6.0, 6.1, 6.2, 7.0, 7.5
a. Show the data in a graph. What pattern is suggested?
b. Examine the frequency distributions of the data. What statistical approach would be the most appropriate to determine whether these treatments vary in their number of sporozoites? Why?
Question 11 - Which statement is FALSE?
A. Correlation should be used to describe a linear, cause-effect relationship between a continuous predictor variable and a continuous response variable.
B. Regression can be used to predict new values of the response variable from new values of the predictor.
C. One purpose of regression is often to determine how much variation in the response variable can be explained by the linear relationship with the predictor.
D. There are two variance components to simple regression, variation that is and is not accounted for by the linear fit.
Question 12 - Use R to make plots and calculations.
Does learning a second language change brain structure? Mechelli et al. (2004) tested 22 native Italian speakers who had learned English as a second language. Proficiencies in reading, writing, and speech were assessed using a number of tests whose results were summarized by a proficiency score. Gray-matter density was measured in the left inferior parietal region of the brain using a neuroimaging technique, as mm3 of gray matter per voxel. (A voxel is a picture element, or "pixel," in three dimensions.) The data are listed in the accompanying table.
|
Proficiency score for second language
|
Gray-matter density (mm3/voxel)
|
|
Proficiency score for second language
|
Gray-matter density (mm3/voxel)
|
|
0.26
|
-0.070
|
|
2.75
|
-0.008
|
|
0.44
|
-0.080
|
|
3.25
|
-0.006
|
|
0.89
|
-0.008
|
|
3.85
|
0.022
|
|
1.26
|
-0.009
|
|
3.04
|
0.018
|
|
1.69
|
-0.023
|
|
2.55
|
0.023
|
|
1.97
|
-0.009
|
|
2.50
|
0.022
|
|
1.98
|
-0.036
|
|
3.11
|
0.036
|
|
2.24
|
-0.029
|
|
3.18
|
0.059
|
|
2.24
|
-0.008
|
|
3.52
|
0.062
|
|
2.58
|
-0.023
|
|
3.59
|
0.049
|
|
2.50
|
-0.006
|
|
3.40
|
0.033
|
a. Display the association between the two variables in a scatter plot.
b. Calculate the correlation between second language proficiency and gray-matter density.
c. Test the null hypothesis of zero correlation.
d. What are your assumptions in part (c)?
e. Does the scatter plot support these assumptions? Explain.
Question 13 - Use R to make plots and calculations.
Biopsy is often used to distinguish cancerous from harmless tumors before resorting to surgery. Ridgway et al. (2004) investigated the ability of MIB-1 monoclonal antibodies, which detect rapidly proliferating cells with staining, to distinguish known breast tumor types from biopsies on a postoperative sample. The following measurements were taken to determine whether the MIB-1 index measured on biopsy is associated with whole tumor size. MIB-1 index was measured double-blind on histological sections of tumor tissue by the number of stained cells counted at a particular microscope magnification.
|
Tumor size (mm)
|
MIB-1 index
|
|
10
|
1
|
|
13
|
39
|
|
15
|
7
|
|
20
|
154
|
|
20
|
141
|
|
20
|
26
|
|
21
|
41
|
|
23
|
1
|
|
25
|
7
|
|
25
|
24
|
|
26
|
67
|
|
30
|
1
|
|
30
|
27
|
|
35
|
1
|
|
35
|
19
|
|
35
|
42
|
|
40
|
37
|
|
45
|
2
|
|
47
|
1
|
|
70
|
23
|
|
130
|
93
|
|
130
|
32
|
a. Examine the association in a graph. What is the trend? Do the data look bivariate normal?
b. Using an appropriate method, and without transforming the data, test whether there is an association between MIB-1 index and tumor size.
Question 14 - The following questions are based on Data available in the example data files on Canvas (Show your work in R, including at least two plots relevant to answering the questions.
You hypothesize that snake activity is related to the number of days above the thermal minimum of the snake. You collect data on snake activity across latitudes and generate the variable "Degree days above the thermal minimum" for snakes at each location. These data and snake activity are in the Statistica file entitled "Data for Exam II". Graphically explore the data. Are any transformations necessary to meet the assumptions of the analyses you would use to test the hypothesis? Which transformation, if any, seems most appropriate based on the residual plots?
A. Square root
B. natural log
C. arcsine square-root
D. inverse
E. no transformation is necessary
Provide the slope of the relationship between snake activity and degree days (to three significant digits). If you transformed the response variable, be sure to conduct the analyses on this transformed variable and do not back transform.
Is the intercept for this analysis significant? If so, what does this mean biologically?
What is the R-squared value and what does it tell us about the relationship between snake activity and degree days?
Note - Want all the answers done in the same R file.
Attachment:- Assignment Files.rar