Reference no: EM131268187
Introduction to Economic Evaluation of Health Promotion Interventions Assignment
Evaluating Cost-effectiveness using Markov cohort models: The HPV case
The goal of this assignment is to provide students with applied practical experience using Markov cohort models to evaluate the cost-effectiveness of alternative decisions, in this case universal HPV vaccination. The Markov cohort model included in this homework assignment is not intended to provide a realistic evaluation of the likely cost-effectiveness of each alternative given the limited nature of Markov cohort models and the artificial nature of a number of assumptions used to populate this model.
Given the complexity of HPV infection and cervical cancer epidemiology and transitions between eating states, decision analysts have determined that microsimulation models will likely provide a better analytic strategy for comparing population health interventions. However, for many of the PAHO interventions, modified cohort models without dynamic transition are still used to aid in transparency of decision-making. Be sure to review units 7.3 and 7.4 in the asynchronous materials before starting this assignment. This content is also covered well starting on page 331 in the Drummond textbook, continuing through page 335.
Students will be provided with a diagram of the state transitions included in the model as well as the probabilities for transferring between states for each of the one-year model cycles. In contrast to the decision tree example from the previous homework assignment, students will be expected to use discounting to provide undiscounted and discounted health outcomes and cost for each of the alternative strategies in this homework. We will not be including half cycle correction in the homework as this is overly complicates the core concepts that we are trying to communicate here.
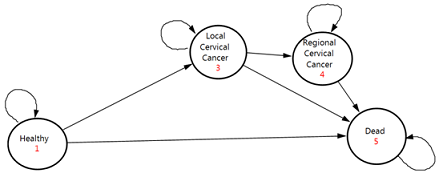
The cohort model described in this homework assignment will be run starting at age 11 (t=0) for 79 cycles or until the entire cohort has died. Assume that the discount rate is 3%. Note that a number of the transition probabilities and costs for this model change depending on the cycle. For example, the risk of transitioning from "healthy" to "local cancer" does not begin until the transition from cycle 38 to cycle 39 and the background mortality from healthy and local cancer does not begin until the same time. The costs of treating cancer are time limited and are described in more detail below.
State Transition Diagram
|
Control
|
|
|
Transition To
|
|
|
Transition From
|
Healthy
|
Local Cervical Cancer (beginning with transition from cycle 38 to 39)
|
Regional Cervical Cancer
|
Dead (Assume 0 from non-cancer until cycle 38, otherwise use below transition starting from 38 to 39 transition )
|
Total
|
|
Healthy
|
0.989925
|
0.000075
|
0.00000
|
0.0100
|
1
|
|
Local Cervical Cancer
|
0
|
0.9875
|
0.0025
|
0.01
|
1
|
|
Regional Cervical Cancer
|
0
|
0
|
0.95
|
0.05
|
1
|
|
Dead
|
0
|
0
|
0
|
1
|
1
|
|
Intervention
|
Transition To
|
|
Transition From
|
Healthy
|
Local Cervical Cancer (beginning with transition from cycle 38 to 39)
|
Regional Cervical Cancer
|
Dead (Assume 0 from non-cancer until cycle 38, otherwise use below transition starting from 38 to 39 transition )
|
Total
|
|
Healthy
|
0.989978
|
0.0000225
|
0
|
0.01
|
1
|
|
Local Cervical Cancer
|
0
|
0.9875
|
0.0025
|
0.01
|
1
|
|
Regional Cervical Cancer
|
0
|
0.00
|
0.95
|
0.05
|
1
|
|
Dead
|
0
|
0
|
0
|
1
|
1
|
|
Model Parameters
|
Estimate
|
|
Life expectancy 80 years
|
80 years
|
|
Age of cervical cancer onset
|
50 years
|
|
Local cancer disability weight (percent healthy time loss)
|
0.08
|
|
Regional cancer disability weight (percent healthy time lost)
|
0.75
|
|
Average annual cost per woman per local cancer treated (costs continue for 5 cycles unless, new costs begin if transition to regional cancer)
|
US$ 1000
|
|
Average annual cost per woman per regional cancer case (costs continue for 5 cycles)
|
US$ 2000
|
|
Cost per fully vaccinated girl
|
US$ 20
|
Deliverables
- Completed Markov cohort model in Excel with calculated cost-effectiveness ratio in terms of cost per DALY averted both in discounted and undiscounted terms
- 250 word commentary on the limitations of using the Markov cohort model in this case as well as the broader limitations of this modeling approach.
|
Graph the price supply equation
: Find a price supply equation of the form p = mx + b. - Find a price demand equation of the form p = mx + b. - Find the equilibrium point.
|
|
Calculate the change in temperature of the gas
: An insulated container is divided into two equal portions. One portion contains an ideal gas at pressure P and temperature T, while the other portion is a perfect vacuum. If a hole is opened between the two portions
|
|
Income statement for the dividends received
: 2014 December 31, Eddy earned net income of $800,00. Eddy paid $5000 to Gordon. Gordon has 10% of Eddy's common shares. What amount should be reported on Gordon's 2014 income statement for the dividends received from Eddy and earnings announced by Ed..
|
|
Part one-organizing
: Now, it is time for all production managers to begin the organizing process. Doing so requires that managers collect the people, resources, and capital to begin production in a way that will implement the short-term production goals and objectives..
|
|
Calculate cost-effectiveness ratio in terms of cost per daly
: Completed Markov cohort model in Excel with calculated cost-effectiveness ratio in terms of cost per DALY averted both in discounted and undiscounted terms
|
|
Job order costing system to get the underapplied
: How do you formulate manufacturing cost incurred vs. manufacturing cost applied when given all this data for Durham Company who uses a Job order costing system to get the underapplied or overapplied overhead?
|
|
Describes logans theory on tribes
: Describes Logan's theory on tribes. Compares Logan's ideas with tribes that you have been a part of in the past. Reflect on how Logan's idea of Tribal Leadership may affect how to approach change. Express your thoughts.
|
|
The retained earnings account before closing had a balance
: Tara Westmont, the stockholder of Tiptoe Shoes, Inc. had annual revenues of $203,000, expenses of $112,700, and the company paid $25,200 cash in dividends to the owner (sole stockholder). The retained earnings account before closing had a balance of ..
|
|
What benefits are gained for educators
: 1. What are benefits that can be gained for learners when there are well written learning objectives? (3 bullets) 2. What benefits are gained for educators? (3 bullets)
|