Reference no: EM132444181
BUSS-B 2012 - Research Methods, Data Analytics and Project Planning - Middle East College
Learning Outcome 1. Design a project plan for business improvement.
Learning Outcome 2. Distinguish the different distributions in statistics.
Learning Outcome 3. Present research findings and opportunities for improvement.
The assignment has 3 different parts and each part should be answered.
Part 1: Descriptive statistics and data analysis
Part 2: Probability calculation, expected value & binomial distributions;
Part 3: Correlation, Regression and Probability Distribution
In the report it is important to show both the results and the way the results were achieved, just a couple of answers will not suffice. Where possible results should be supported by graphs. Please do not print out entire Excel files as an appendix. All graphs and tables should have a correct and appropriate layout.
The report must have the following structure
• Introduction
• Literature Review
• Project Plan (Gantt Chart)
• Data Analysis and Cleaning of Dataset
• Order Profiles and Walking Distances in a Warehouse
• Poisson Distribution and Normal Distribution
• Conclusion
• References (including MOOC, OMREN-Masader etc.)
Report Structure
Introduction, Literature Review, Project/Assignment Plan (Gantt Chart), Conclusion, References.
Part 1:
In the file that goes with this assignment an article file is given of the spare parts warehouse of Ford, Fiat, and Kia. In total there are data on 150 SKUs.
Part 2:
In this assignment we will help Logistat Inc. make a number of strategic, tactical, and operational choices using statistical calculations. The various problems can be solved using the supplied data file.
To be able to make the assignments you have the sales files of Logistat Inc. over a period of one month and you have the article file.
Part 3:
In this assignment we will help Logistat Inc. make a number of strategic, tactical, and operational choices using statistical calculations. The various problems can be solved by use of the supplied data files.
Learning goals:
Part 1:
Goal of this assignment is to learn to deal with the cleaning of data sets based on the correct criteria and to analyse these data sets using tables, standards, and visualizations.
Part 2:
This question is meant to apply knowledge achieved during the statistics lectures to a number of daily logistical problems.
Part 3:
The goal of this assignment is to apply statistical knowledge, acquired during the Statistics course, to problems faced during daily logistics operations.
Part 1: Data analysis and cleaning of data sets
a) Clean the data using the below steps:
• Check the data set for contamination.
• Filter any bad data from the data set.
• Show what data have been filtered based on what criteria and state which percentage has been filtered out.
For the rest of the assignment work with the cleaned data set (unless stated differently).
b) Make a frequency table of the brand showing:
• Frequency
• Relative frequency
• Cumulative frequency
• Cumulative relative frequency
c) Make a bar chart for the absolute frequency of the brand.
d) Make a classified frequency table of the weight per article.
e) Make a histogram of the absolute frequency of the number of weight per article.
f) Determine mode, median, and average of the number of sold pieces per year.
g) Determine the range of the number of pieces per pallet. (2 Marks)
h) Make a box plot of the number of sold pieces per year and the weight per article (use the unfiltered data set here). Determine the extremes.
i) Check whether the number of replenishment lines per day is normally distributed using the standards for shape.
Part 2: Order profiles and walking distances in a warehouse
Logistat Inc. wants to increase the efficiency of their warehouse. The warehouse manager is considering relocating stock in the warehouse.
The following groups are given:
|
AA-articles (super fast movers):
|
5% of the articles
|
|
A- articles (fast movers):
|
15% of the articles
|
|
B- articles (medium movers):
|
12% of the articles
|
|
C- articles (slow movers):
|
68% of the articles
|
a) Make a graph showing the ABC-analysis (see book: "Introduction into Logistics") for the articles of Logistat Inc. In the graph the y-axis shows the cumulative percentage of orderliness and the x-axis shows the cumulative percentage of SKUs.
b) Per group (AA, A, B, C) determine the number and percentage of SKUs, the number, and percentage of order lines and the number and percentage of used storage locations. Show this in a table.
c) What is the average number of order lines per order?
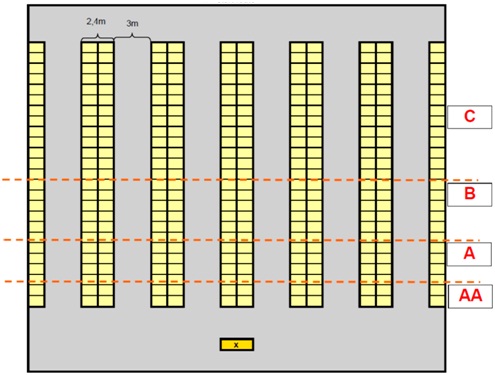
On the next page two lay-outs are shown. These lay-outs are also given in the data file. To simplify the problem all stock is placed on ground level locations. A pallet location has a width of 0.8m and a depth of 1.2m. Between two pallet locations there is a space of 0.1m. The lines given in the lay-outs to separate the areas (e.g. AA and A) are indicative.
Warehouse lay-out A
(layout dimensions are decisive. Separations between groups indicative) x = start route
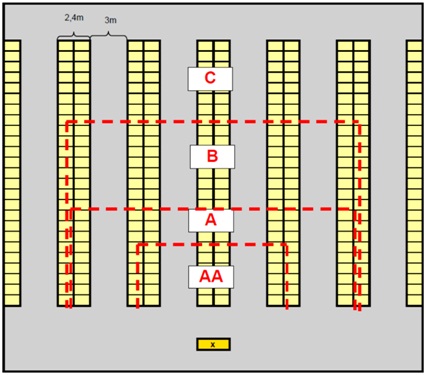
Warehouse lay-out B
(layout dimensions are decisive. Separations between groups indicative) x = start route
d) Based on the number of used locations per group (AA, A, B, and C) determine the exact allocation of groups within the two warehouse lay-outs.
- You can do this by colouring the locations of the different groups in the lay-outs.
- It is possible that the lines are not exactly straight.)
Answer the following questions for both warehouse lay-outs:
e) What is the expected walking distance for an AA, A, B, and C article for both lay-outs?
- To determine the average walking distance, you can follow two strategies:
1. Determine per location the walking distance and then take the average per group.
2. Determine how far you have to walk on average in horizontal direction and sequentially how far you have to walk on average in vertical direction.)
f) What is the expected walking distance in the warehouse for 1 random order line if only 1 order line is picked per route? For this use the distances as calculated in answer e). Based on this calculation which warehouse design would you choose?
g) What is the probability that one or more C SKUs is/are required for the following number of order lines per order: 3, 4, 5, and 12?
h) What is the probability that you only need AA or A articles for the following number of order lines per order: 3, 4, 5, and 12?
i) What can you conclude about increasing efficiency by allocating stock based on the product turn-over when the number of order lines per order increase?
Part 3: Correlation, Regression and Probability Distributions.
Using the emergency order data provided, discuss the following with necessary tables, graphs and trend lines.
a) Discuss relationship (Correlation) between each variable (Order Picking, Packaging and Shipping) with separate tables, graphs and scatterplots.
b) Generate 3 valid Regression Equation for predicting any Emergency Order Variables. Discuss the result with line fit plots, normal probability plot and key outcomes.
c) Predict any 5 set of data using the generated regression equations.
Attachment:- Data Analytics and Project Planning.rar