Reference no: EM132223376
Neural Networks Lab: Unsupervised Learning
Competitive learning network
Suppose you want to categorize the following 6 two-dimensional vectors into two classes:
>> inp = [0.1 0.8 0.1 0.9 0.2 0.7;0.7 0.9 0.8 0.8 0.75 0.9];
Each column of this matrix represents one two-dimensional input vector. There are three vectors near the (0,1) and three vectors near (1,1). What now?
First, create a two-layer network with two input "feature" neurons and two output "category" neurons. To do this, create a random 2x2 matrix of weights:
>> W=rand(NCAT,NFEATURES);
where NCAT=2 and NFEATURES=2.
Competitive learning works optimally if the weight vector associate with each output neuron is normalized to 1:
>> W=W./repmat(sqrt(sum(W.^2,2)),1,NFEATURES);
This network needs to be trained to classify properly. In this network, the output neurons compete to respond to the input in a winner-take-all fashion such that only the weight vector feeding into the winning output neuron is trained. We could implement this by including inhibitory connections between the two output neurons and let the dynamics of the network find the winner as in Figure 2. To make things easier, however, we will use the max function in Matlab to find the winner and then apply the competitive learning rule to the winner's weight vector. We will also assume that the winner's activation equals 1. Create a function that implements the competitive learning training rule with a learning rate parameter, lr:
>> function [Wout]=train_cl(W,inp,lr)
>> %competitive learning rule
>> out=W*inp;
>> [mx ind]=max(out);
>> W(ind,:)=W(ind,:)+lr*(inp'-W(ind,:));
>> Wout=W./repmat(sqrt(sum(W.^2,2)),1,size(W,2));
end
Notice that the weight vectors associated with the winning output neuron is renormalized after training.
Use this training rule and create a script to classify the six input vectors. In this script, you will expose the network to all inputs one at a time over many epochs. In the script, plot the inputs and the two weight vectors (with the quiver function) associated with each output neuron after each epoch so that the learning process can be visualized.
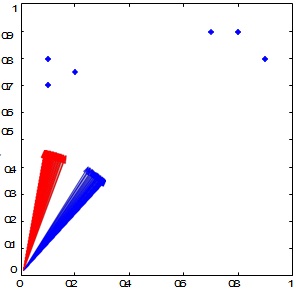
Figure 6. The six two-dimensional inputs are plotted as blue stars. The evolution of the two weight vectors (blue and red arrows) associated with the two output neurons during training of a competitive learning neural network.
The results of the trained network should be:
>> results = 1 2 1 2 1 2
This indicates that the 1st, 3rd, and 5th input vector activated neuron 1 and the 2nd, 4th, and 6th input vector activated neuron 2. Of course, because this is an unsupervised neural network, the results could also be the exact opposite:
>> results = 2 1 2 1 2 1
You may notice that your neural network does not always categorize your inputs into two categories but rather into one category. This is because one of the weight vectors is accidently very far away from any input and, therefore, never wins the competition.
These are called "dead units". You will also notice that the winning weight vector is pointing in between the two classes of inputs. Can you think of a way to solve this problem?
Hopfield Network
We will now build a Hopfield neural network to store two 4-dimensional patterns.
The two column vectors we will store are:
[1 1 -1 -1]' and [ -1 -1 1 1]'
Place those two input vectors into a 4x2 matrix called inp (i.e. the external input to the network).
Create a matrix,W, that stores these two patterns using a Hebbian-type learning rule:
>> for i=1:size(inp,2)
>> W=W+inp(:,i)*inp(:,i)';
>> end;
>> W=W-diag(diag(W));
The last line of this code ensures that the diagonals of the weight matrix are zero. This is because the Hopfield network requires that there be no self-connectivity. Now, test to see whether those two patterns were stored in the network. To do this, write code that updates the state of each neuron of the network with a certain probability, p, which implies that not all neurons will be necessarily updated at the same time (i.e. asynchronous updating). If the neuron's state is updated, then a simple thresholding operation is performed. If the net input to the neuron is greater than or equal to zero, then the state of the neuron should be set to 1. Otherwise, the state of the neuron should be set to -1. Create a function called update_hp that takes the net input, the weight matrix W, the current state of the system, and the update probability p, and updates the state of the network.
Let us now feed the trained Hopfield network with one of the two column vectors that we used to build the network: [1 1 -1 -1]'. Let us set the state of the network at t=0 to be all zeros: state(0)=[0 0 0 0]'. The net input at each time point, t, is:
>> net_input= [1 1 -1 -1]'+W*state;
Therefore, at t=0, net_input(0)=[1 1 -1 -1]'. Using the net input, update the state of the network:
>>newstate=update_hp(W, state, net_input, p);
Repeat this multiple times (e.g. 1000 times) until the state of the system equilibrates.
Now feed partial input test patterns, Test, to the network and see where the network equilibrates:
>> Test=[1 1 0 0; 0 0 -1 -1]';
The zeros correspond to missing features in the test patterns. Does the network fill in the missing information?
The Matlab Neural Network Toolbox
Mathworks has developed a specialized toolbox for neural networks. As we have shown above, everything that constitutes a neural network (Inputs, Weights, Transfer function and Outputs) can be implemented using matrices and matrix operations.
However, the Neural Network Toolbox has a rich variety of different types of neural networks that can be easily implemented and have been optimized.
3. Project
this relationship is far from perfect.
Greebles live in dangerous times.
Recent events led to the creation of the "Department for Greeble Security". You are a programmer for this recently established ministry and your job is to write software that distinguishes the "good" Greebles from the "bad" Greebles. Researchers in another section of the department have shown that three parameters correlate with the tendency that a Greeble is good or bad. These parameters are: "boges" length, "quiff" width and "dunth" height [7]. Specifically, it has been shown that good Greebles have long boges, thin quiffs and high dunths while the bad Greebles tend to have short boges, thick quiffs and low dunths. Of course,
A given individual Greeble might have any number of variations of these parameters. In other words, this classification is not as clear-cut and easy as your superiors might want it to be. That's where you come in. You decide to solve this problem with a neural network, since you know that neural networks are well suited for this kind of problem.
In this project, you will be asked to create two neural networks.
1) The first neural network will be a competitive learning network that distinguishes good from bad Greebles. Specifically, you should do the
following:
a) Train the network with the training set on Canvas (it contains data on Greebles who have been shown to be good or evil in the past, along with their parameters for boges length, quaff width and dunth height.) Plot the training data in three dimensions along with the two weight vectors associated with the good and evil output neurons using quiver3.
b) Test the network with the test set on Canvas (it contains parameters on Greebles that were recently captured by the department and suspected of being bad. Use your network to determine if they are (more likely to be) good or bad).
c) Document these steps, but make sure to include a final report on the test set. Which Greebles do you (your network) recognize as being bad, which do you recognize as being good?
d) Qualitatively evaluate the confidence that you have in this classification. Include graphs and figures to this end.
Good luck! The future and welfare of the Greebles rests in your hands. Hints:
• Load the two training populations using the command xlsread(‘filename'). Each file contains measurements of three parameters (in inches): Boges length, quaff width and dunth height. Each row represents an individual Greeble.
• Before you do anything else, you might want to plot your populations in a three- dimensional space (you have three parameters per individual). You can do this by using plot3(param1,param2,param3). In other respects, plot3 works just like plot.
• Merge the data into a big training vector
• Create the competitive network
• Train the competitive network
• Download the test files and test the population with your trained network
• Your program should produce a final list which Greebles in the test population are good and which are bad. Also: Graph input weights before and after training.
• Disclaimer: No actual Greebles were hurt when preparing this tutorial.
2) The second neural network that you will create is a Hopfield network that will store the prototypical good and bad Greeble. Specifically, you should do the following
a) Normalize the features of all the Greebles so that the largest feature value across all Greebles for each of the three features is 1 and the lowest feature value is -1.
b) Create the prototypical good and bad Greebles by taking the average features of the good and bad Greebles, respectively.
c) Build a Hopfield network to store the good and bad prototypes (i.e. two feature vectors).
d) Use the test set to see if the Hopfield network can categorize the suspected Greebles as prototypical good or bad Greebles. Compare these results with the results using the competitive learning network.
The equilibrium state of the Hopfield network should be one of these two vectors:
[1 -1 1] or [-1 1 -1] for the good and bad Greebles, respectively.
Attachment:- Lab NeuralNets.rar