Reference no: EM132409855
BIOL 3310 Foundations of Population Ecology Assignment - University of Manitoba, Canada
1. There is some question about the future of a native species of fish population in face of a highly competitive invasive species. You have been contracted to develop exploratory models to investigate the potential outcomes. Both species exhibit logistic population growth on their own. Competition between them can be represented by adding classic Lotka-Volterra competition coefficient terms to the density dependent part of the differential equation for each species. In addition, your model should allow for the potential enhancement of the native species as a conservation measure. Your literature search suggests that the native species (species 1) and invasive species (species 2) have similar carrying capacities, and there was a stable population of 10,000 of the native species prior to invasion. Historical data suggests that after a major perturbation the native species can increase its numbers with a maximum instantaneous growth rate per capita of 1.8. Literature review also suggests that the invasive species has twice the maximum, instantaneous per capita population growth rate as the native species. Competitively, individuals of the invasive species use 25% more of the available resources (α12 = 1.25, α21 = 0.75). Write out the equations (not R code) for the model that includes competition and allows enhancement of the native population. What is the expected outcome of the system without enhancement? How much enhancement is required to maintain the natural population at ½ K? (Provide figures to support your answers and commented code in an appendix at the end of the assignment.
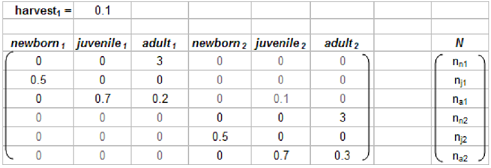
2. Often a stage based model must be used when specific ages are not identifiable in the population being studied. Consider a population containing identifiable newborns, juveniles, and adults.that move between two habitats. The following matrix represents a system of two habitats (1 and 2), each with transitions defined by the upper right and lower left of the matrix. The stage structured numbers in each habitat are represented by a single vector N in which the first 3 elements refer to habitat 1 and the last 3 elements refer to habitat 2. Harvest can be represented by a decline in survival for the juveniles and adults in habitat 1, but there is no harvest in habitat 2: it is a wildlife preserve.
Finally, some juveniles from habitat 2 migrate to become adults in habitat 1 (10%). Review your notes on matrix models until you understand how this works and then analyze the matrix model below to answer the questions that follow (note that the harvest has been removed from the appropriate matrix parameters illustrated in the figure).

Increase the harvest rate from 0.1 (by 0.1) until no adults in habitat 1 survive beyond a single year. How does the growth of the metapopulation vary among the harvest rates that you have examined? What is the effect of eliminating juvenile migration from metapopulation exploited at these rates? Which cell in this metapopulation matrix would you modify to represent a dispersal of newborns from habitat 1 that arrive in habitat 2 to become juveniles?