Analyze a dataset from options provided

Assignment Help Applied Statistics
Reference no: EM131418818

Graduate level organized and scientific and statically sound solutions to be presented Follow all hints and specifications

The project is to use R to analyze a dataset from options provided at the end. And write a affective and scientifically and statically sound and organized report. The report needs to be a graduate level of critical thinking reflection and well organized. "Zero plagiarism". The report should reflect an higher level of understanding in all means - programming, scientifically, statistically.

4 pages for written single-spaced text with solid backgrounds, strong critical thinking in terms of what answers you want to find for the strong questions you will be asking from the data to find(remember based on the questions you ask your critical thinking will be analyzed asking merely simple questions will not meet the criteria. The questions should be of graduate level critical hypothesis clearly stated followed by how can you get reply to the question you posed and why you think this question is important what important applicable information will it give and how the information will be applicable and useful scientifically and statistically sound discussion and complete interpretation of results, and general to specific conclusions. (Always also include P-values but don't limit yourself to only p values all the discussion should be complete and thorough and in appropriate English and scientific language)

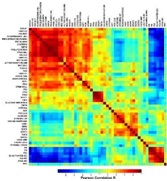
(***Hint for report to follow by students start with a generalized overall big hypothesis or question like finding the patterns in the whole set of data generate a picture-
1897_Figure.jpg

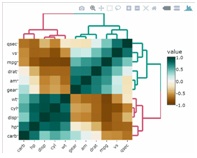
followed by getting in to more specific questions from the overall pattern to specific hypothesis and pattern which would look like
555_Figure1.jpg

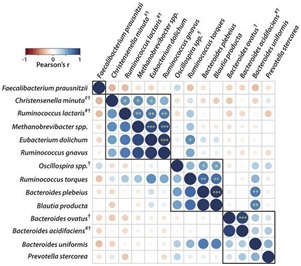
later add the omplexity of layers of information in one picture to extract more info- it would look like-
959_Figure2.jpg

More than 7 advanced figures should be included following the 4 pages of text. The figures generated should be like publishable pictures for paper. They need to be visually appealing ( using basic colors will cut down points use of advanced color such as forest green, antique white etc us recommended the trick is you can select advanced plate and make figures but it will not help you with good grade the purpose is for you to make your own Palate with advanced colors and generate publishable pictures) For example see the picture below.( however you should also include appropriate readable title and labels for each picture of yours in addition )

555_Figure1.jpg

This picture above is incomplete you need to take it as an example and complete the pic with titles and labels.
2181_Figure3.jpg

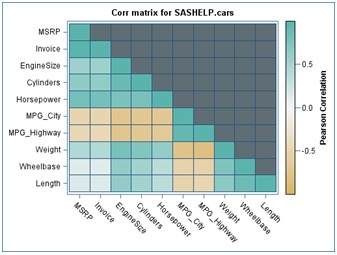
In this above figure the flaw is you don't want to have that grey part so you need to develop a one with out it for triangle maps also colors are easy and straight conveying the message but these are not an own made advance color palate.

So an complete full picture of what this assignment want you to produce and this pictures below its requirment as part of five pictures you will generate for the report others you can pick of choice but meeting the criteria specified already-

See for the details there are yellow stars on some bubbles two starts for p<0.05 starts for p<0.01 You also need to mention the detail under this picture about what stars indicate.

2. Picture you need to produce this.

3. You need to include this

1897_Figure.jpg

3. You need to produce this but use advanced color palate of your own and make sure labels are clear and readable.
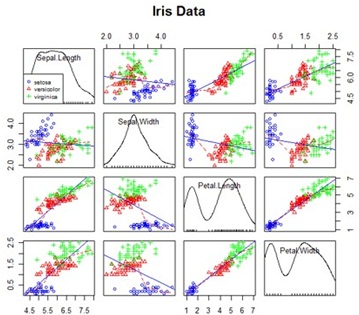
1943_Figure4.jpg

You can also generate a figure like this.

Below each figure explain what information is conveyed by each picture in complete. ALL the labels, axis, titles and reader scales should be clearly readable. Basic colors should not be used for any figure. The reader scale should be clear visible, complete , not overlapping on picture.

Figures required are below- You must add any other which are reflection of complex yet appealing demonstration.

References to sources of information or data should be included in text and at the end of report. Follow APA format for references. R code later organize the stepwise-command lines followed by command description should be included as appendix.

Data sets for projects: You can choose one from below data options for the project but do mention a little bit about which one you selected in report.

1. 2. 100 interesting datasets: https://rs.io/100-interesting-data-sets-for-statistics

2. A link to many datasets. At https://www.statsci.org/datasets.html

3. Other datasets at UCI data repository https://archive.ics.uci.edu/ml/index.html

4. Investigate weather data to see global trends in climate https://graphical.weather.gov/xml/

https://www.ncdc.noaa.gov/data-access/quick-links

Reference no: EM131418818

Questions Cloud

Major causes of inaccurate job analysis data : What are some of the major causes of inaccurate job analysis data? What might you do to reduce or eliminate errors?
Define the maintenance concept for the new system : Perform an abbreviated feasibility analysis and discuss the various alternative technical approaches you may wish to consider in designing the new system.
Job description help in the recruitment effort : How does the job description help in the recruitment effort? How does the job description help newly hired employees? Why are accurate and up-to-date job descriptions so important?
Affirmative action paper-signature assignment : Prepare a 700- to 1050-word paper in which you discuss the elements of affirmative action as it applies to public sector and private sector employers and how it interacts with Title VII requirements of Equal Employment Opportunity. Your paper must..
Analyze a dataset from options provided : Graduate level organized and scientific and statically sound solutions to be presented Follow all hints and specifications - The project is to use R to analyze a dataset from options provided at the end. And write a affective and scientifically and ..
What are the basic steps involved in system analysis : What are the basic steps involved in system analysis? Construct a basic flow diagram illustrating the process, showing the steps, and including feedback provisions.
What resources are available for victims in your state : What resources are available for victims in your state? (Waashington State) Is compensation available for victims? What gaps do you see in victim resources? Share an idea you may have about victim resources for your state, one that may be missing ..
Assignment on positive and professional : 1. Some social critics say that too many people these days are rude, crude, and inconsiderate of others. Do you agree or disagree? Explain in detail.
Determining the first impressions : The authors of First Impressions say that making a good first impression means making the person you meet feel positive toward you. When you have contact with someone, do you think about how the other person is feeling during the initial contact, ..

Reviews

len1418818

3/8/2017 2:14:06 AM

References to sources of information or data should be included in text and at the end of report. Follow APA format for references. R code later organize the stepwise-command lines followed by command description should be included as appendix. Follow all the Hints and specifications for to make your report don’t assume any thing DEADLINE WILL NOT BE EXTENDED 12:00pm CENTRAL- or else submission to turnitin will be locked ZEROPLAGARISM ALL THE INSTRUCTIONS SHOULD BE READ CAREFULLY AND ALL NEEDS TO BE FOLLOWED. Graduate level organized and scientific and statically sound solutions to be presented Follow all hints and specifications ---

Write a Review

Applied Statistics Questions & Answers

  Computer network manager wants to test

Computer network manager wants to test the reliability of some new and expensive fiber-optic cables that the computer department just received. The department received 4 boxes, each containing 30 cables. The manager selects one cable at random from e..

  Estimate the process standard deviation

The thickness of a printed circuit board is an important quality parameter. Data on board thickness (in inches) are given in Table 6E.4 for 25 samples of three boards each. (a) Set up and R control charts. Is the process in statistical control? (b) E..

  The control chart is a graph used to track and monitor

The control chart is a graph used to track and monitor how a process develops or changes over time. A control chart always has a central line for the average, an upper line for the upper control limit and a lower line for the lower control limit. The..

  What are the tax consequences of the share certificate

Advise John Jones of the tax consequences of Items 1 – 6, above. You should discuss what amounts would be included in his assessable income or, if any item is not assessable income, why that is so. Your answer should include a discussion of the follo..

  What percentage of filled bottles do not meet the standard

Bottles containing less than 15.95 oz do not meet the bottler's quality standard. What percentage of filled bottles do not meet the standard?

  What is a reverse mortgage

What is a reverse mortgage? Is a reverse mortgage good or bad ? Why? Present this article to the class and explain why you chose the example. Include the URL for the site you used. Do not copy the text in the site verbatim. You should summarize y..

  Perform exploratory data analysis on the relevant variables

Perform exploratory data analysis on the relevant variables in the dataset. When possible, include appropriate graphs to help illustrate the dataset.

  Calculate the mean, median and mode

State the statistical assumptions of this test and using the data set and variables you have selected, use SPSS to calculate the Mean and Median.

  State null hypotheses for the researchers test

State the null and alternative hypotheses for the researchers test - explain in the context of this scenario the meaning of Type I and Type II errors.

  A data set is normally distributed with mean

Assume a data set is normally distributed with mean 160 and standard deviation 25. If the data set contains 300 data values, approximately how many of the data values will fall within the range 110 to 210?

  Important for a security professional

Why is it important for a security professional to know specifics about the particular target environment to which they are assigned? How can experienced security professionals prepare themselves for challenges and opportunities they have never encou..

  Identify the benefits of using e-learning

What is the reality of the use of e-learning from the perspective of students of the First Level in the Department of Management Information Systems at University of Hail

Free Assignment Quote

Assured A++ Grade

Get guaranteed satisfaction & time on delivery in every assignment order you paid with us! We ensure premium quality solution document along with free turntin report!

All rights reserved! Copyrights ©2019-2020 ExpertsMind IT Educational Pvt Ltd