Reference no: EM13879163
Methods
Participants
Individuals who participated in this study were all undergraduate students from various colleges. Students were specifically selected from psychology courses and were required to participate for class credit. The participant data was stratified into men and women and from there, a total of 40 participants was selected. Equal group sizes were formed with one group consisting of 20 men and another group consisting of 20 women. All participants ranged from 18 to 64 years of age with the average participant being 31.5 years old. Participants in the group of women ranged between age 18 and 64 with the average participant being 36.8 years old, whereas participants in the group of men ranged between 18 and 49 with the average participant being 26.2 years old.
Materials
This study was conducted via an online lab in which participants needed access to a computer. In addition, participants needed computer speakers or headphones prior to beginning the experiment. The online lab provided an unlimited sequence of numbers with the length of sequences consecutively increased by one digit after each sequence length was presented twice. Spreadsheet software was also implemented to download and sort the data that had been collected by the online lab.
Procedure
Individuals who volunteered for this study were directed to an online lab in which they could participate in the experiment. Participants needed to make sure they had either computer speakers or headphones before beginning the experiment.Additionally, participants were instructed to ensure the volume on their computer was turned up to an appropriate level. They were given a unique user identification number so their results could be identified. Participants then signed a consent form informing them of their experiment and detailing the task they were to complete. Following this, participants were asked to provide their age and gender before proceeding to the experiment. Participants were given a practice trial in which they heard a sequence of numbers and were then asked to enter those numbers in the same order back into the browser by using their mouse to click on the numbers they had heard. After the practice, participants could click to begin the experiment whenever they made any necessary adjustments to volume or monitor brightness. The first sequence presented contained one digit and was presented twice. Each following sequence had one digit added to the length and was also presented twice. If participants correctly remembered digits in only one of the two sequences per sequence length, the next sequence length was presented to them. The online lab continued adding one digit to sequence length until the participant incorrectly entered both sequences for a particular sequence length. Once this occurred, the experiment was concluded and participants were given their score. The highest number of digits remembered by participants was recorded as their score. Once data was collected from various psychology course students, the data was stratified into men and women categories. From each category, 20 participant data were selected and analyzed.
Results
It was found that the average number of digits remembered by women and men were very similar with the women at and the men at. Overall, men and women appeared to have similar digit recall when presented with auditory sequences of numbers as each group had roughly the same number of participants per digit length remembered. These comparisons are presented in Figure 1 "Clustered Column Chart Shows the Frequency of Digits Remembered by Men and Women Following an Auditory Presentation of Number Sequences".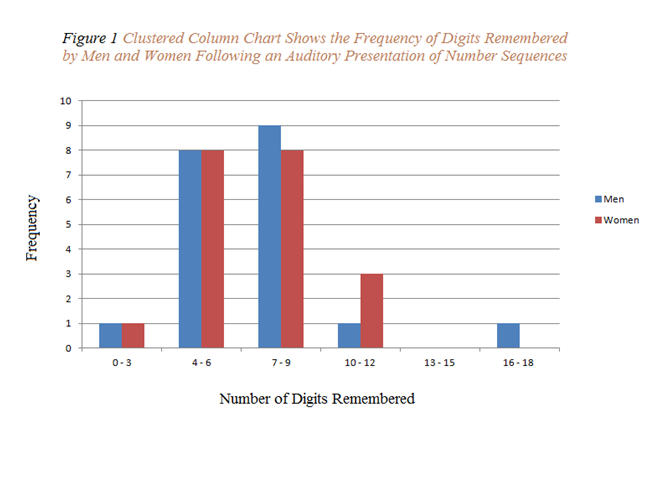
Furthermore, it has been found that 75% of the values fall within one standard deviation of the mean, 95% of values fall within two standard deviations of the mean, and 100% of values fall within three standard deviations of the mean for the sample group of women. This data set is representative of a normal distribution. Similarly, it was found that 80% of the values fall within one standard deviation of the mean, 95% of values fall within two standard deviations of the mean, and 100% of values fall within three standard deviations of the mean for men - also representing a normal distribution.
|
Hydrostatic force on the panel
: Panel BCD is semicircular and line BC is 8 cm below the surface. Determine
|
|
Describe the feminist phase theory
: Describe The Feminist Phase Theory
|
|
Find the optimal transportation plan
: Find the optimal transportation plan of this problem.
|
|
Analysis of find the velocity v
: Modify the analysis of Fig to find the velocity v? when the inner cylinder is fixed and the outer cylinder rotates at angular velocity O0. May this solution be added to Eq. (4.146) to represent the flow caused when both inner and outer cylinders r..
|
|
All undergraduate students from various colleges
: Individuals who participated in this study were all undergraduate students from various colleges. Students were specifically selected from psychology courses and were required to participate for class credit. The participant data was stratified into ..
|
|
Method of depreciation for its depreciable assets
: During 2011 and 2012, Faulkner Manufacturing used the sum of the years digits (SYD) method of depreciation for its depreciable assets, for both financial reporting and tax purposes.
|
|
Classify cash and accounts payable as elements of accounting
: Classify each of the following as elements of the accounting equation using the following abbreviations: A = Assets; L = Liabilities; C = Capital. Cash, Accounts Payable, Owners' Investment and Accounts Receivable.
|
|
Understanding and supporting gender equity in schools
: Understanding and Supporting Gender Equity in Schools
|
|
Find optimal transportation routes
: A plant has four warehouses (a, b, c, and d ) to ship the products to customers directly. The warehouses a, b, c, and d have 14, 16, 17, and 15 units in stock, respectively. The customer's demands are 18, 19, and 20 units for x, y, and z. The cost..
|