Reference no: EM131099755
Goals
• To read and understand someone else's code.
• To use the 5 methods of finding errors.
• To use DEBUGGER to step through code.
• To solve a problem useful in the earth sciences.
Useful MATLAB info - the Debugger
The DEBUGGER is a program that allows you to run code a bit at a time so that you can see how variables change and the flow of control occurs (and/or goes wrong). See the text pages 305-334. The important steps are:
• SET (one or more) breakpoints. These can be placed at specific lines of code (key F12), or when certain things happen, like a warning, or a divide-by-zero (from Debug Menu).
• RUN the code (F5). When it reaches a breakpoint execution stops, an arrow in the editor will show the line to be executed next, AND a special command line (K>>) appears in the command window. You can use the command line to investigate the status of variables by a) typing them out, b) plotting them, c) doing a little math with them, d) etc. You can also view the values of arrays in the ARRAY EDITOR.
• CONTINUE running the code either by running until the next breakpoint (F5) , or by stepping through lines of code one by one (F10, or F11 if you want to "step into" another file)
Background Information: I want to make a map of ocean surface currents. Looking around on the web, I found an oceanographer who has produced a set of gridded current data, derived from ship drift records. You can download his data in large .csv (comma-separated variable) files. One of them (a summer, or May/Jun/July average), has been placed on the course web page. I have also started to write code (plotarrows.m and mean2d.m) to make the maps, but the code (also available on the course web site) has errors. It will be YOUR job to fix these errors.
Algorithm description
The .csv file is pretty easy to load, but it is just a list of 42730 lat/long points (Open the file in an editor to see what it contains). For each point there is an associated pair {u, v} of eastward and northward velocities (in m/s). Fortunately it seems that these are not at random locations. Instead they seem to be at points on a regular grid, spaced at 1 degree increments in latitude and longitude, centered on integer-valued longitudes and latitudes. However, the land points are missing (because there is no data there), which is why there are only 42730 points rather than 360 × 180 = 64800 points.
So, the FIRST thing in done in plotarrows is to put the data into rectangular matrices, with individual longitudes along the columns and individual latitudes alone the rows (just like the topo dat in previous labs), and land locations marked with NaN
Then, we want to SMOOTH the data a bit. We have dealt with running mean windows in 1D (for time series). Now we generalize to a 2D case, which I am implementing in mean2d. For a ’window size’ of 3, we average a square of 3 × 3 = 9 values, centered on a location (draw a picture for yourself to make sure you understand how this works).
There are 3 kinds of ’edge effects’ to deal with. First, you have to wrap in longitude (as in lab 5). Second, there is no wrapping in latitude (if you go too far north or south). The easiest thing is to do is to not use the ’nonexistant’ row of points (i.e. use 6 point and 3 point averages close to the boundary, for a window size of 3). Also, if your window contains land squares, you don’t want to include them in the average. That is, if (say) the top left corner of the square is on land, you replace the center point with an average of only the other 8 points, which are NOT in land.
Finally, we use imagesc to make a plot of the velocity MAGNITUDES, M = √ u 2 + v 2, and then overplot a) a coastline, and b) a SUBSAMPLED set of the velocity vectors as little sticks that BEGIN at the lat/long location of the velocity vector, and then stick away from it in the direction of the current.
The Lab:
Code in (plotarrows.m and mean2d.m) attempts to implement the algorithm. But right now it contains a
number of bugs. Some of these are SYNTAX errors, some are ALGORITHM errors, and some are INPUT errors.
In this lab you should:
1. Carefully examine the code. Does it match the description of what I have said it should do?
2. Debug the code.
3. Hand in the debugged code.
4. For an extra credit, replace the two line commands at the bottom of plotarrows.m with a DOUBLE
LOOP that does the same thing.
To Hand In:
Hand in the CORRECTED script file plotarrows.m and function mean2d.m. COMMENT YOUR CORRECTIONS!
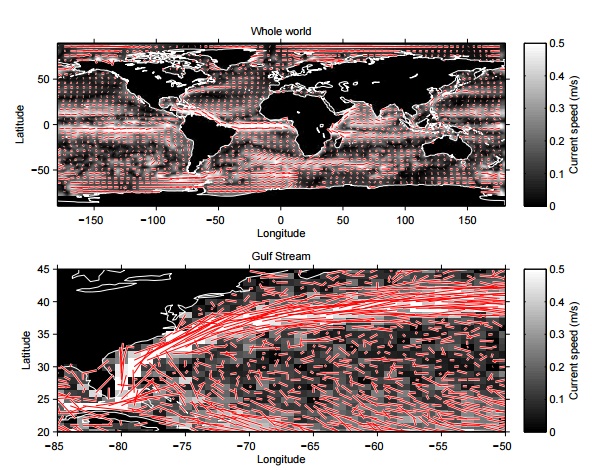
I will test them with the following code. It should make the attached plot.
clf;
subplot(211);
plotarrows_orig(’mgsva_MJJ.csv’,5,10);
title(’Whole world’);
subplot(212);
plotarrows_orig(’mgsva_MJJ.csv’,1,7);
axis([-85 -50 20 45]);
title(’Gulf Stream’);
plotarrows.m must ALSO (as usual) contain the following lines:
partner.name=’YYYYYY’;
partner.stu=’ZZZZ’;
Time_spent= XX;
with the correct information substituted.