Reference no: EM131108733
Question 4.1: What is the level of private savings? Question 4.2: What is the level of government savings? Question 4.3: What is the status of the budget balance? Question 4.4: What is the level of national savings?
Question 4.5: According to the savings-investment spending identity for an open economy, what is the amount of investment spending in this economy?
Figure 1: A hypothetical AD-AS model for Canada
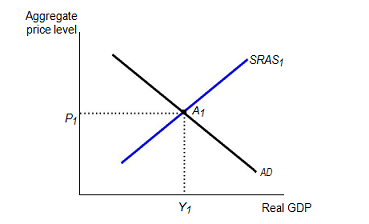
Question 1.1: (Ref. Figure 1) During the 1990s, many stock market investors in Canada became optimistic about information technology and bid up stock prices, especially those of high-tech companies; this was referred to as the "dot-com bubble." However, when the new technologies started to appear less profitable than they had originally seemed, investment spending fell and the prices of many stocks fell sharply, wiping billions of dollars from investors' accounts. For example, from September 2000 to September 2001, the price of Nortel stock fell from more than $120 to less than $10. The stock market crash reduced Canadian household wealth and, in turn, consumer spending.
Show graphically the effects of this stock market crash on the short-run macroeconomic equilibrium. Write briefly all the necessary steps.
Question 1.2: (Ref. Figure 1) Recent fall in the national unemployment rate increased consumer confidence about the future of the economy. Show graphically the effects of each of this fall in the national unemployment rate on the short-run macroeconomic equilibrium. Write briefly all the necessary steps.
Ref. Figure 2: The figure below shows an economy's aggregate demand curve and its short-run and long-run aggregate supply curves (labelled AD, SRAS, and LRAS, respectively). Initially, the economy is in macroeconomic equilibrium.
Figure 2: A hypothetical AD-AS model
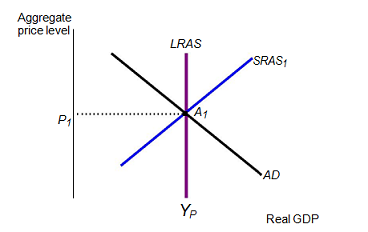
Question 2.1: (Ref. Figure 2) The government announces that households will pay much higher taxes.
- Show graphically the effect on the short-run macroeconomic equilibrium. Write briefly all the necessary steps.
- What type of output gap do we have in this situation?
- Show graphically the long-run self-correcting mechanism in the economy. Write briefly all the necessary steps.
- Assume that the government uses the fiscal policy to close the output gap. What type of fiscal policy the government should use to close the output gap. Show graphically the effects of the prescribed fiscal policy. Write briefly all the necessary steps.
Question 2.2: (Ref. Figure 2) The year 1979 was a bad year for all oil-importing nations. The overthrow of the Shah of Iran's dictatorship in a popular revolution disrupted world oil markets. The result was a sharp increase in the price of oil. This increase in oil prices greatly affected aggregate supply in oil-importing nations.
- Show graphically the effect on the short-run macroeconomic equilibrium. Write briefly all the necessary steps.
- What type of output gap do we have in this situation?
- Show graphically the long-run self-correcting mechanism in the economy. Write briefly all the necessary steps.
- Assume that the government uses the fiscal policy to close the output gap. What type of fiscal policy the government should use to close the output gap. Show graphically the effects of the prescribed fiscal policy. Write briefly all the necessary steps.
Question3. Question 3.1: For simplicity, let's assume that every household has a marginal propensity to consume (MPC) of 0.75. If the government implements a fiscal policy involving its purchases of goods and services, by how much should government purchases (G) change to increase the GDP by $4trillion?
Question 3.2: For simplicity, let's assume that every household has a marginal propensity to consume (MPC) of 0.75. If the government implements a fiscal policy involving government transfers (TR), by how much should government transfers change to increase the GDP by $4trillion?
Question 3.3: For simplicity, let's assume that every household has a marginal propensity to consume (MPC) of 0.75. What can you conclude about the effect of fiscal policy involving government purchases (question 3.1) and fiscal policy involving government transfers (question 3.2) on aggregate demand?
Scenario 4: The following table contains data for a hypothetical open economy. The amount of investment spending is unknown.
|
GDP
|
$8,000
|
|
Consumption (C)
|
$4,000
|
|
Government spending (G)
|
$1,100
|
|
Tax (T)
|
$1,300
|
|
Transfer payment (TR)
|
$500
|
|
Export (X)
|
$500
|
|
Import (IM)
|
$350
|
|
|
|
|
Critical analysis-evaluate the lesson-argument
: Two-page maximum (articles) single space, business block, justified margins, 10-point font
|
|
Discuss the politics involved with the budgetary process
: Identify and explain the role of key actors who have influence over the budgetary process, Explain how the budgetary constraints led to the outcome of the case and Discuss the politics involved with the budgetary process.
|
|
Which statements about subjective contours is true
: Although the retinal image changes, we easily recognize the rectangular shape of a door whether it is closed, partially open, or completely open.
|
|
What is the required air feed rate
: How would the answer change if the combustion were only 75% complete?
|
|
A hypothetical ad-as model for canada
: During the 1990s, many stock market investors in Canada became optimistic about information technology and bid up stock prices, especially those of high-tech companies; this was referred to as the "dot-com bubble." However, when the new technologies ..
|
|
Deferred tax asset with previous valuation account
: Record income tax expense, deferred income taxes, and income taxes payable for 2011, assuming that it is more likely than not that none of the deferred tax asset will be realized.
|
|
Use each project''s radr to select the better project
: Like most firms in its industry, Yeastime Bakeries uses a subjective risk assessment tool of its own design. The tool is a simple index by which projects are ranked by level of perceived risk on a scale of 0-10.
|
|
What is the overall effectiveness of each screen
: Assuming the analyses are accurate, what do they show about the ratio by weight of each of the three fractions actually obtained? What is the overall effectiveness of each screen?
|
|
Record income tax expense, deferred income taxes
: Assuming that it is more likely than not that $30,000 of the deferred tax asset will not be realized, prepare the journal entry at the end of 2011 to record the valuation account.
|