Reference no: EM133064653
5MA044 Applied Instrumentation and Control - University of Wolverhampton
Question 1: a) Explain what is meant by Passive and Active sensor giving one example of each.
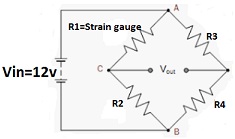
b) A balanced Wheatstone bridge is shown in Figure 1.1.
The strain gauge with a gauge factor of 2, is increased in length by 250µm (dL/L)
Calculate the voltage output Vout.
(GF = (dR⁄R)/dL/L) (R1 = R2 = R3 = R4 = 120Ω)

Figure 1.1
c) An actuator has a length of 20 mm. A full bridge configuration of strain gauge with a gauge factor of 2 and a nominal resistance of 350 Ω is used to measure strain when the actuator is stretched. The dc supply to the bridge is 5 V. Determine.
I. The mechanical strain that would result for a change of 2 mm in the actuator length.
II. The corresponding output voltage of the bridge.
Question 2:
The engine, body and tires of a racing vehicle affect the acceleration and speed attainable.
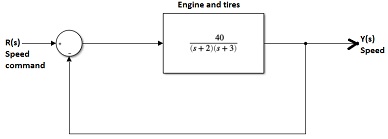
The speed control of the car is represented by the model shown in Figure 2.1.

Figure 2.1
a) Determine the percent overshoot (P.O.), the time to peak TP, and the settling time TS of the unit step response for the closed -loop system shown in Figure 2.1.
Sketch an estimation of the response.
b) Determine the percent overshoot (P.O.), the time to peak TP, and the settling time TS of the unit step response for the proportional control closed-loop system shown in Figure 2.2, when Kp = 0.2.
Sketch an estimation of the response.

Figure 2.2
c) Comparing your answers from part a) and part b) and describe the expected differences between the step response of the original system and the step response of the proportionally controlled system.
Question 3: a) Determine the closed-loop system transfer function Y(s)/R(s) for the system shown in Figure 3.

Figure 3
b) Determine the range of stability for K ≥ 0.
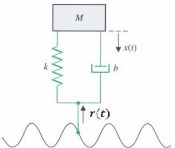
Question 4: As an automobile moves along the road, the vertical displacement at the tires acts as the motion excitation to the automobile suspension system.
Figure 4 is a schematic diagram of a simplified automobile suspension system, for which we assume the input is sinusoidal.

Figure 4
a) Determine the Transfer Function X(s)/R(s).
b) Sketch the Bode plot when M = 1 kg, b = 4 Ns/m and k = 1.8 N/m.
Question 5: A unity feedback control system has an open loop transfer function:
G(s) = K/S(S + 2)(S + 6)
a) For gain K = 27, obtain the Bode plot and show that the Gain Margin is G. M. = 11 dB
b) To achieve a Gain Margin G. M. = 28 dB, determine the value of the gain K.