1what is the proportion of females at statcrunchu determine

Assignment Help Advanced Statistics
Reference no: EM13380621

1. What is the proportion of females at StatCrunchU, Determine a range of plausible values for this proportion. Is this proportion significantly larger than 0.5,

2. How are the students distnbuted across the classes of Freshman (1), Sophomore (2), Junior (3) and Senior (4), Does the proportion of females change across the classes,

3. What does the distnbvtion of credit hours look like, Does the mean number of credit hours per student appear to be significantly below 15 hours, Does the distribution of credit hours appear to be impacted by gender or class,

4. what is the proportion of students at StatCruncht/ that work, For those that do work, charactenze the distribution of the number of hours worked per week. For those students that work, also descnbe the relationship between the number of hours worked per week and the number of credit hours taken. Does this relationship appear to deer for full time students (enrolled in 12 or more credit hours) and part time students (enrolled in less than 12 credit hours),

5 What is the proportion of students at StatCruncht) that have loans, For those that do have loans. characterize the distribution of the loan amounts. Oo gender and/or class have an impact on the distnbution of loan amount, For students that work, is there a relationship between the amount of loans they have and the number of hours per week that they work,

6. What is the proportion of students at StatCrunchll that have credit card debt, For those students who have credit card debt, does the amount of credit card debt appear to be influenced by any one or any combination of the other variables,

1. In Part A of this assignment, you selected a random sample of 30 StatCrunch U students and created a StatCrunch file containing data from the above survey for those students. You will use the StatCrunch data file you created in Part A to complete this assignment. Following the instructions at the end of Part A, paste your StatCrunch data file in the space below. This will allow your instructor to see your data.

PASTE YOUR SAMPLE DATA HERE:
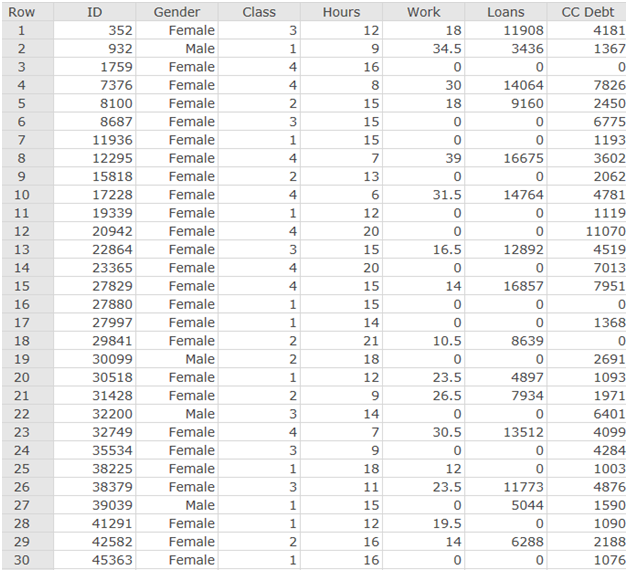
1801_How are the students distnbuted across the classes of Freshman.png

2a. State a question related to a categorical variable that can be answered using your survey data and the techniques you have studied thus far in this course. You are encouraged to develop your own question, but you may use an appropriate question from the StatCrunch website. The question you use should be about the entire population of StatCrunch U students-not just about those in the sample. Assume that your sample is representative of the population.

b. Explain the methodology you will use to answer the question you posed. Your explanation should include answers to the following questions. Do not include your analysis or answers to your question here-only describe how you will do the analysis.

  • What is the variable of interest?
  • What graphical techniques will you use to describe your data?
  • Why are those techniques appropriate? Why did you choose them?

c. Carry out the methodology described in b above. Use StatCrunch and paste copies of the graphs/charts from StatCrunch in the space below.

d. Based on the results of b and c above, answer your question. Include an explanation of how you used the graphs and charts to formulate your answer.

3a. State a question related to a numerical variable that can be answered using your survey data and the techniques you have studied thus far in this course. You are encouraged to develop your own question, but you may use an appropriate question from the StatCrunch website. The question you use should be about the entire population of StatCrunch U students-not just about those in the sample. Assume that your sample is representative of the population.

b. Explain the methodology you will use to answer the question you posed. Your explanation should include answers to the following questions. Do not include your analysis or answers to your question here-only describe how you will do the analysis.

  • What is the variable of interest?
  • What graphical techniques will you use to describe your data?
  • Why are those techniques appropriate?
  • Why did you choose them?
  • What numerical measures will you use to describe your data?
  • Why are those measures appropriate? Why did you choose them?

c. Carry out the methodology described in b above. Use StatCrunch and paste copies of the graphs/charts and numerical summaries from StatCrunch in the space below.

d. Based on the results of b and c above, answer your question. Include an explanation of how you used the graphs, charts, and numerical summaries to formulate your answer.

Reference no: EM13380621

Questions Cloud

Based on the information below calculate the weighted : based on the information below calculate the weighted average cost of capital.great corporation has the following
Volworld communications inc a large telecommunications : volworld communications inc. a large telecommunications company is evaluating the possible acquisition of bulldog
Volvo trucks emigrates airlines is already implementing : volvo trucks emigrates airlines is already implementing several approached to improve quality. strong competition that
Explain the difference between formal and informal team and : explain the difference between formal and informal team and describe two different organizational
1what is the proportion of females at statcrunchu determine : 1.what is the proportion of females at statcrunchu determine a range of plausible values for this proportion. is this
Consider the following investment cash flowsyearcash : consider the following investment cash flowsyearcash flow020001200020315004250054000a. what is the present year 0 value
For the next fiscal year you forecast net income of 50000 : for the next fiscal year you forecast net income of 50000 and ending assets of 500000. your firms payout ratio is 10.
Alice has now been investing for several years and she : alice has now been investing for several years and she would like to build an investment portfolio. her investment
1 analyze the structure of the variable rate debt described : 1. analyze the structure of the variable rate debt described in the case updates vrdos etc.. ?a explain the put call

Reviews

Write a Review

Advanced Statistics Questions & Answers

  Cultural dimension comparison of us

Information of a historical, political, economic, or social nature that helps to explain the values and placement on the various cultural dimensions will be helpful. Your results will be presented in a written report.

  Management-bill of material

One end item A requires three component parts: B, C, and D. The bill of material indicates that for each completed A, 3 units of B, 2 units of C, and 1 unit of D are required.

  Plan the analysis

Plan the analysis

  Effect of safety stock on reorder point

A company normally orders the EOQ of 120 units and the reorder point is 30 units. However, due to changing conditions, it has become necessary for the company to carry safety stock to prevent stock outs. Which of the following should occur?

  Techniques in business-economics

A sample of the monthly amounts spent for food by families of four receiving food stamps approximates a symmetrical distribution. The sample mean is $150 and the standard deviation is $20.

  Test of hypothesis for furniture store

A furniture store claims that a specially ordered product will take on average, a mean of 42 days to arrive. The standard deviation of these waiting times is 7 days. We suspect that the special orders are taking longer than this.

  Determining applied research and statistics

Discuss how this observation should be considered when building a research plan. How might it impact the level of detail you include in your plan?Discuss key issues and concerns arising from the fact tht you, the manager, are also the researcher?

  Enforcement of affirmative action

In describing the relationship of affirmative action and descriptive statistics, I said, "Affirmative action is the legal enforcement of policies, descriptive statistics is specific descriptive data derived from research.

  Sophisticated statistical analysis-simple analysis

Is it acceptable for a researcher to refrain from reporting the use of highly sophisticated statistical analysis and opt for simpler forms of analysis? Explain.

  Different types and levels of statistics

Identify different types and levels of statistics. Describe the role of statistics in business decision making.

  Application methods for financial management

Prepare a cash budget with borrowing needed or repayments for November and December. (You will need to prepare a cash receipt schedule first).

  Purpose of business research

What is the purpose of business research? What is the definition of a hypothesis? Compare and contrast the difference between scientific and business research.

Free Assignment Quote

Assured A++ Grade

Get guaranteed satisfaction & time on delivery in every assignment order you paid with us! We ensure premium quality solution document along with free turntin report!

All rights reserved! Copyrights ©2019-2020 ExpertsMind IT Educational Pvt Ltd