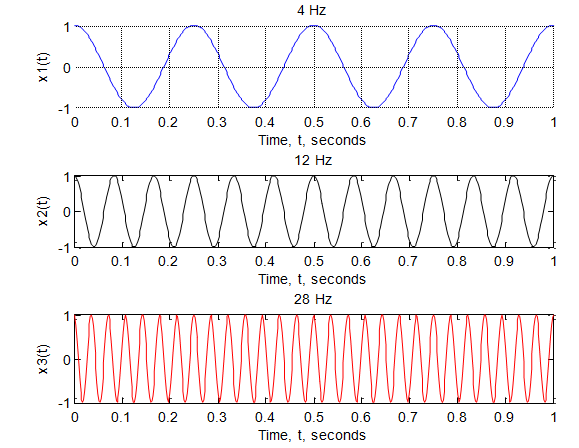
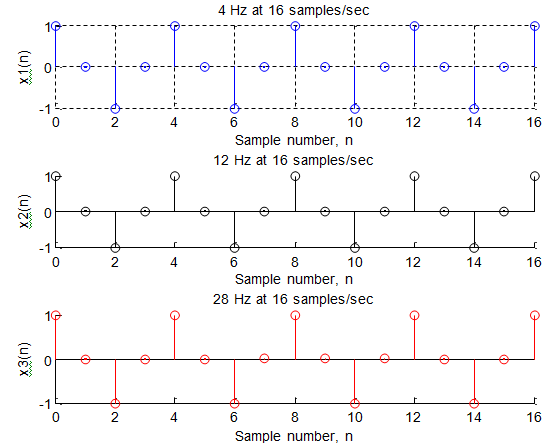
Aliasing and digital frequency With Fs = 16 Hz the base band signal should be band-limited to 8 Hz. And we don't expect frequencies higher than 8 Hz. Consider the 3 signals x1(t), x2(t), and x3(t) of frequencies 4Hz, 12Hz and 28Hz, respectively, here x2 and x3?s frequencies are the aliases of x1?s. The continuous and discrete-time signals are given in the table below with the sampling rate of 16 samples/sec.
|
Aliasing and Digital Frequency
|
|
Analog frequency
Cycles/sec
|
Analog signal
|
Discrete-time signal
|
Digital frequency
Cycles/sample
|
|
4
|
x1(t) = cos 2π4t
|
x1(n) = cos 2π(1/4)n
|
0.25
|
|
12
|
x2(t) = cos 2π12t
|
x2(n) = cos 2π(3/4)n
|
0.75
|
|
28
|
x3(t) = cos 2π28t
|
x3(n) = cos 2π(7/4)n
|
1.75
|
|
8
|
x4(t) = cos 2π8t
|
x4(n) = cos 2π(1/2)n
|
0.5
|
|
16/3
|
x5(t) = cos 2π(16/3)t
|
x5(n) = cos 2π(1/3)n
|
1/3
|
If Nyquist criterion is to be satisfied (for the perfect signal reconstruction) we do not expect digital frequencies higher than 0.5 cycle/sample (or π rad./sample) in base band signal. This corresponds to taking two samples for every cycle (or digital frequency of half a cycle per sample) - the Nyquist criterion. The Digital frequencies higher than 0.5 cycle (x2(n)and x3(n) in this example) are actually not allowed.
When plotted x1(n), x2(n), and x3(n) can't be distinguished from one another for
the digital frequency. They all have a period = 4 and a frequency of 0.25 cycle per sample, and we know that x2(n) has a frequency of 0.75 cycle and x3(n) has a frequency of 1.75 cycle.
Generally any digital frequency above 0.5 cycle (π rad./sample) is an alias (or shows up as an alias of some base band frequency). It in fact has more cycles per sample than is apparent in a plot of sampled data.
The phenomenon of aliasing using the 2 waveforms x1(t), x2(t), and x3(t) and the corresponding sequences x1(n), x2(n), and x3(n) is demonstrated below.
In MATLAB:
%Aliasing demo
%First---------------------------------------------
%Plot the continuous-time waveforms x1(t), x2(t), and x3(t) over a 1-second interval t = 0: 1/500: 1;
x1 = cos (2*pi*4*t); %4 Hz
subplot(3, 1, 1), plot(t, x1, 'b'); %subplot(3, 1, 1) - 3 rows, 1 column, #1 xlabel ('Time, t, seconds'), ylabel('x1(t)');
title ('4 Hz')
grid;
x2 = cos (2*pi*12*t); %12 Hz
subplot(3, 1, 2), plot(t, x2, 'k'); %subplot(3, 1, 2) - 3 rows, 1 column, #2 xlabel ('Time, t, seconds'), ylabel('x2(t)');
title ('12 Hz')
x3 = cos (2*pi*28*t); %28 Hz
subplot(3, 1, 3), plot(t, x3, 'r'); %subplot(3, 1, 3) - 3 rows, 1 column, #3 xlabel ('Time, t, seconds'), ylabel('x3(t)');
title ('28 Hz')
%Second---------------------------------------------
%Plot the sequences x1(n), x2(n), and x3(n)
n = 0: 1: 16;
%4 Hz sampled at 16 Hz x1 = cos (n*pi/2);
subplot(3, 1, 1), stem(n, x1, 'bo'); %subplot(3, 1, 1) - 3 rows, 1 column, #1 xlabel ('Sample number, n'), ylabel('x1(n)');
title ('4 Hz at 16 samples/sec')
grid;
%12 Hz sampled at 16 Hz x2 = cos (3*n*pi/2);
subplot(3, 1, 2), stem(n, x2, 'ko'); %subplot(3, 1, 2) - 3 rows, 1 column, #2 xlabel ('Sample number, n'), ylabel('x2(n)');
title ('12 Hz at 16 samples/sec')
%28 Hz sampled at 16 Hz x3 = cos (7*n*pi/2);
subplot(3, 1, 3), stem(n, x3, 'ro'); %subplot(3, 1, 3) - 3 rows, 1 column, #3 xlabel ('Sample number, n'), ylabel('x3(n)');
title ('28 Hz at 16 samples/sec')
%---------------------------------------------


Email based Aliasing and digital frequency assignment help - Aliasing and digital frequency homework help at Expertsmind
Are you finding answers for Aliasing and digital frequency based questions? Ask Aliasing and digital frequency questions and get answers from qualified and experienced Digital signal processing tutors anytime from anywhere 24x7. We at www.expertsmind.com offer Aliasing and digital frequency assignment help -Aliasing and digital frequency homework help and Digital signal processing problem's solution with step by step procedure.
Why Expertsmind for Digital signal processing assignment help service
1. higher degree holder and experienced tutors
2. Punctuality and responsibility of work
3. Quality solution with 100% plagiarism free answers
4. On Time Delivery
5. Privacy of information and details
6. Excellence in solving Digital signal processing queries in excels and word format.
7. Best tutoring assistance 24x7 hours