Level of significance, Applied Statistics

Assignment Help:

Level of Significance: α

The main purpose of hypothesis testing is not to question the computed value of the sample statistic, but to make judgment about the difference between the sample statistic and a hypothesized population parameter. The next step after stating the Null and Alternative Hypotheses, is to decide what criterion to be used for deciding whether to accept or reject the null hypothesis.

When we choose 5% level of significance in a test procedure, there are about 5 cases in 100 that we would reject the hypothesis when it should be accepted, that is, we are about 95% confident that we have made the right decision. Similarly, if we choose 1% level of significance in testing a hypothesis, then there is only 1 case in 100 that we would reject the hypothesis when it should be accepted.

Suppose, that under a given hypothesis the sampling distribution of a statistic θ is approximately a normal distribution with mean

E (θ) and standard deviation (Standard Error) σθ

Figure 

1879_level of significance.png


Then z = 2357_level of significance1.png

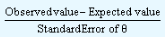
is called the standardized normal variable or z-score, and its distribution is the standardized normal distribution with mean 0 and standard deviation 1, the graph of which is shown above.

From the above figure, we see that if the test statistic z of a sample statistic  θ lies between -1.96 and 1.96, then we are 95% confident that the hypothesis is true [since the area under the normal curve between z = -1.96 and z  = 1.96 is 0.95 which is 95% of the total area].

But if for a simple random sample we find that the test statistic (or z-score) z lies outside the range -1.96 to 1.96, i.e. if z  > 1.96, we would say that such an event could happen with probability of only 0.05 (total shaded area in the above figure if the given hypothesis were true). In this case, we say that z-score differed significantly from the value expected under the hypothesis and hence, the hypothesis is to be rejected at 5% (or 0.05) level of significance. Here the total shaded area 0.05 in the above figure represents the probability of being wrong in rejecting the hypothesis. Thus if z  > 1.96, we say that the hypothesis is rejected at a 5% level of significance.

The set of z scores outside the range -1.96 and 1.96, constitutes the critical region or region of rejection of the hypothesis or the region of significance. Thus critical region is the area under the sampling distribution in which the test statistic value has to fall for the null hypothesis to be rejected. On the other hand, the set of z scores inside the range -1.96 to 1.96 is called theregion of acceptance of the hypothesis. The values -1.96 and 1.96 are called critical values at 5% level of significance.

From the above discussion we can formulate the following rule of decision:

Decision Rule (Two-Sided Tests)

Significant level

z Value

Decision

5%

5%

1%

1%

| z |  > 1.96

| z |  < 1.96

| z |  > 2.58

| z |  < 2.58

Reject

Accept

Reject

Accept                                              


Related Discussions:- Level of significance

the npv of the book , Bill Clinton reportedly was paid $10 million to writ...

Bill Clinton reportedly was paid $10 million to write his book My Way. The book took three years to write. In the time he spent writing, Clinton could have been paid to make speech

Scatter diagram - correlation analysis, Scatter Diagram The first step ...

Scatter Diagram The first step in correlation analysis is to visualize the relationship. For each unit of observation in correlation analysis there is a pair of numerical value

Quantitative Models, Consider the following new business venture. An agent ...

Consider the following new business venture. An agent is considering investment in one of three real estate parcels: • Option 1: multiunit rentals • Option 2: commercial building

Calculate the length of the rope, The tension, T, in the tow rope pulling t...

The tension, T, in the tow rope pulling the car in Newtons is given in P8.  Determine the minimum length of the rope l, between A and B, so that the tension in either AB or AC equa

Draw a network diagram for this problem, The project of building a backyard...

The project of building a backyard swimming pool consists of eight major activities and has to be completed within 19 weeks. The activities and related data are given in the follow

Coefficient of determination, Coefficient of Determination The c...

Coefficient of Determination The coefficient of determination is given by r 2 i.e., the square of the correlation coefficient. It explains to what extent the variation

Weight distribution, What does the confidence level of a confidence interva...

What does the confidence level of a confidence interval tell you? Suppose that a population has mean, µ, and standard deviation, σ.  What does the central limit theorem tell us

Test for equality of two means, Let X 1  and X 2  be two independent po...

Let X 1  and X 2  be two independent populations with population means μ 1  and  μ 2  respectively. Two samples are taken, one from each population, of sizes n 1  and n 2  re

Measurement errors models, How can we analyse data with four bilateral resp...

How can we analyse data with four bilateral response variables measured with errors and three covariated measured without errors?

Transformation of data, PCA is a linear transformation that transforms the ...

PCA is a linear transformation that transforms the data to a new coordinate system such that the greatest variance by any projection of the data comes to lie on the first coordinat

Write Your Message!

Captcha
Free Assignment Quote

Assured A++ Grade

Get guaranteed satisfaction & time on delivery in every assignment order you paid with us! We ensure premium quality solution document along with free turntin report!

All rights reserved! Copyrights ©2019-2020 ExpertsMind IT Educational Pvt Ltd